|
Download Data (XLS File) |
|
||||||||
|
||||||||
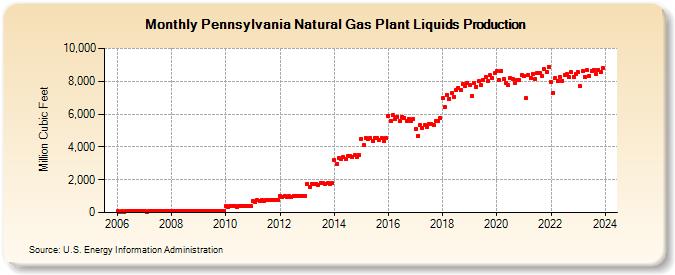
| Pennsylvania Natural Gas Plant Liquids Production (Million Cubic Feet) | ||||||||
| Year | Jan | Feb | Mar | Apr | May | Jun | Jul | Aug | Sep | Oct | Nov | Dec |
|---|---|---|---|---|---|---|---|---|---|---|---|---|
| 2006 | 66 | 59 | 67 | 64 | 67 | 66 | 68 | 68 | 66 | 69 | 66 | 69 |
| 2007 | 70 | 64 | 72 | 69 | 73 | 71 | 72 | 73 | 71 | 74 | 73 | 76 |
| 2008 | 84 | 80 | 86 | 83 | 86 | 84 | 88 | 87 | 74 | 84 | 84 | 87 |
| 2009 | 112 | 102 | 112 | 107 | 110 | 107 | 109 | 110 | 104 | 109 | 105 | 108 |
| 2010 | 373 | 344 | 381 | 371 | 386 | 369 | 388 | 392 | 381 | 400 | 387 | 406 |
| 2011 | 726 | 642 | 744 | 729 | 755 | 726 | 755 | 764 | 738 | 787 | 771 | 793 |
| 2012 | 1,022 | 937 | 1,006 | 971 | 1,007 | 968 | 1,027 | 1,022 | 994 | 1,030 | 998 | 1,022 |
| 2013 | 1,750 | 1,585 | 1,750 | 1,716 | 1,767 | 1,707 | 1,799 | 1,795 | 1,733 | 1,796 | 1,756 | 1,784 |
| 2014 | 3,198 | 2,957 | 3,297 | 3,269 | 3,359 | 3,268 | 3,449 | 3,467 | 3,354 | 3,501 | 3,366 | 3,505 |
| 2015 | 4,504 | 4,088 | 4,546 | 4,463 | 4,546 | 4,389 | 4,549 | 4,555 | 4,435 | 4,550 | 4,385 | 4,531 |
| 2016 | 5,897 | 5,595 | 5,913 | 5,719 | 5,842 | 5,599 | 5,833 | 5,787 | 5,563 | 5,726 | 5,588 | 5,709 |
| 2017 | 5,115 | 4,685 | 5,304 | 5,139 | 5,310 | 5,189 | 5,417 | 5,414 | 5,331 | 5,607 | 5,595 | 5,747 |
| 2018 | 6,960 | 6,418 | 7,188 | 6,945 | 7,259 | 7,060 | 7,441 | 7,591 | 7,466 | 7,813 | 7,693 | 7,911 |
| 2019 | 7,797 | 7,090 | 7,886 | 7,669 | 7,985 | 7,748 | 8,051 | 8,247 | 8,011 | 8,351 | 8,214 | 8,478 |
| 2020 | 8,634 | 8,068 | 8,640 | 8,142 | 7,912 | 7,766 | 8,167 | 8,141 | 7,887 | 8,087 | 8,068 | 8,349 |
| 2021 | 8,310 | 6,950 | 8,392 | 8,185 | 8,451 | 8,149 | 8,500 | 8,525 | 8,306 | 8,720 | 8,533 | 8,892 |
| 2022 | 7,981 | 7,278 | 8,190 | 8,004 | 8,276 | 8,033 | 8,367 | 8,421 | 8,276 | 8,537 | 8,272 | 8,425 |
| 2023 | 8,569 | 7,710 | 8,658 | 8,309 | 8,658 | 8,281 | 8,622 | 8,675 | 8,412 | 8,701 | 8,549 | 8,846 |
| 2024 | 10,301 | 9,902 | 10,356 | 9,929 | 10,275 | 10,063 | 10,531 | 10,433 | 10,026 | 10,504 | 10,167 | 10,698 |
| - = No Data Reported; -- = Not Applicable; NA = Not Available; W = Withheld to avoid disclosure of individual company data. |
| Release Date: 6/30/2026 |
| Next Release Date: 7/31/2026 |