|
Download Data (XLS File) |
|
||||||||
|
||||||||
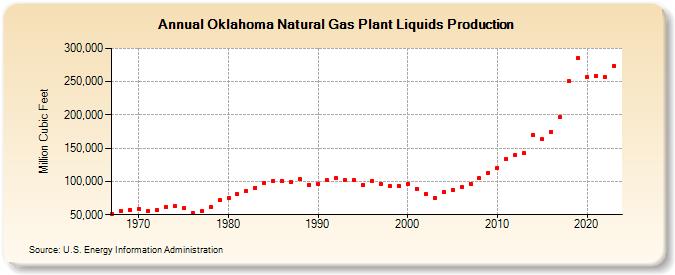
| Oklahoma Natural Gas Plant Liquids Production (Million Cubic Feet) | ||||||||
| Decade | Year-0 | Year-1 | Year-2 | Year-3 | Year-4 | Year-5 | Year-6 | Year-7 | Year-8 | Year-9 |
|---|---|---|---|---|---|---|---|---|---|---|
| 1960's | 50,952 | 55,724 | 57,270 | |||||||
| 1970's | 58,926 | 55,914 | 56,376 | 61,647 | 62,860 | 60,008 | 52,087 | 55,238 | 61,868 | 71,559 |
| 1980's | 74,434 | 80,401 | 85,934 | 90,772 | 98,307 | 99,933 | 100,305 | 99,170 | 103,302 | 94,889 |
| 1990's | 96,698 | 101,851 | 104,609 | 101,962 | 101,564 | 94,930 | 100,379 | 96,830 | 92,785 | 93,308 |
| 2000's | 96,787 | 88,885 | 81,287 | 74,745 | 84,355 | 87,404 | 91,937 | 96,643 | 104,689 | 112,891 |
| 2010's | 120,631 | 134,032 | 139,928 | 142,595 | 169,864 | 163,408 | 174,440 | 197,203 | 250,548 | 285,457 |
| 2020's | 257,268 | 257,979 | 256,883 | 274,427 | 263,115 |
| - = No Data Reported; -- = Not Applicable; NA = Not Available; W = Withheld to avoid disclosure of individual company data. |
| Release Date: 6/30/2026 |
| Next Release Date: 7/31/2026 |