|
Download Data (XLS File) |
|
||||||||
|
||||||||
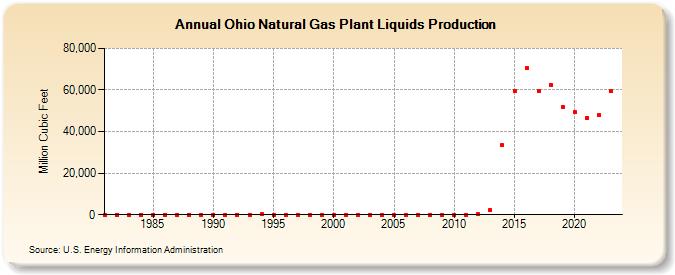
| Ohio Natural Gas Plant Liquids Production (Million Cubic Feet) | ||||||||
| Decade | Year-0 | Year-1 | Year-2 | Year-3 | Year-4 | Year-5 | Year-6 | Year-7 | Year-8 | Year-9 |
|---|---|---|---|---|---|---|---|---|---|---|
| 1980's | 20 | 23 | 29 | 41 | 67 | 68 | 50 | 44 | 46 | |
| 1990's | 58 | 49 | 72 | 95 | 104 | 94 | 85 | 83 | 78 | 78 |
| 2000's | 78 | 86 | 72 | 68 | 58 | 29 | 5 | 9 | 0 | 0 |
| 2010's | 0 | 0 | 155 | 2,116 | 33,332 | 59,490 | 70,451 | 59,669 | 62,570 | 51,980 |
| 2020's | 49,359 | 46,575 | 47,893 | 59,426 | 73,463 |
| - = No Data Reported; -- = Not Applicable; NA = Not Available; W = Withheld to avoid disclosure of individual company data. |
| Release Date: 6/30/2026 |
| Next Release Date: 7/31/2026 |