|
Download Data (XLS File) |
|
||||||||
|
||||||||
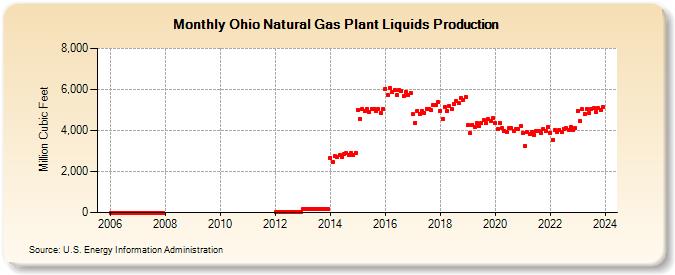
| Ohio Natural Gas Plant Liquids Production (Million Cubic Feet) | ||||||||
| Year | Jan | Feb | Mar | Apr | May | Jun | Jul | Aug | Sep | Oct | Nov | Dec |
|---|---|---|---|---|---|---|---|---|---|---|---|---|
| 2006 | 0 | 0 | 0 | 0 | 0 | 0 | 0 | 0 | 0 | 0 | 0 | 0 |
| 2007 | 1 | 1 | 1 | 1 | 1 | 1 | 1 | 1 | 1 | 1 | 1 | 1 |
| 2012 | 13 | 12 | 13 | 13 | 13 | 13 | 13 | 13 | 13 | 13 | 13 | 13 |
| 2013 | 177 | 160 | 177 | 173 | 179 | 173 | 182 | 181 | 175 | 181 | 177 | 180 |
| 2014 | 2,665 | 2,464 | 2,748 | 2,725 | 2,800 | 2,724 | 2,875 | 2,890 | 2,796 | 2,918 | 2,806 | 2,922 |
| 2015 | 5,004 | 4,543 | 5,051 | 4,959 | 5,051 | 4,876 | 5,055 | 5,061 | 4,928 | 5,055 | 4,872 | 5,035 |
| 2016 | 6,041 | 5,732 | 6,058 | 5,858 | 5,985 | 5,736 | 5,976 | 5,928 | 5,699 | 5,866 | 5,724 | 5,848 |
| 2017 | 4,780 | 4,378 | 4,956 | 4,802 | 4,962 | 4,849 | 5,062 | 5,059 | 4,982 | 5,239 | 5,228 | 5,370 |
| 2018 | 4,963 | 4,577 | 5,126 | 4,952 | 5,176 | 5,034 | 5,306 | 5,413 | 5,324 | 5,571 | 5,486 | 5,641 |
| 2019 | 4,243 | 3,858 | 4,291 | 4,173 | 4,345 | 4,216 | 4,381 | 4,487 | 4,359 | 4,544 | 4,470 | 4,613 |
| 2020 | 4,355 | 4,069 | 4,358 | 4,106 | 3,991 | 3,917 | 4,119 | 4,106 | 3,978 | 4,079 | 4,069 | 4,211 |
| 2021 | 3,874 | 3,240 | 3,912 | 3,815 | 3,939 | 3,799 | 3,962 | 3,974 | 3,872 | 4,065 | 3,978 | 4,145 |
| 2022 | 3,898 | 3,555 | 4,000 | 3,909 | 4,042 | 3,923 | 4,087 | 4,113 | 4,042 | 4,169 | 4,040 | 4,115 |
| 2023 | 4,993 | 4,492 | 5,045 | 4,841 | 5,045 | 4,825 | 5,024 | 5,054 | 4,901 | 5,070 | 4,981 | 5,154 |
| 2024 | 6,143 | 5,905 | 6,176 | 5,921 | 6,128 | 6,001 | 6,280 | 6,222 | 5,979 | 6,264 | 6,063 | 6,380 |
| - = No Data Reported; -- = Not Applicable; NA = Not Available; W = Withheld to avoid disclosure of individual company data. |
| Release Date: 6/30/2026 |
| Next Release Date: 7/31/2026 |