|
Download Data (XLS File) |
|
||||||||
|
||||||||
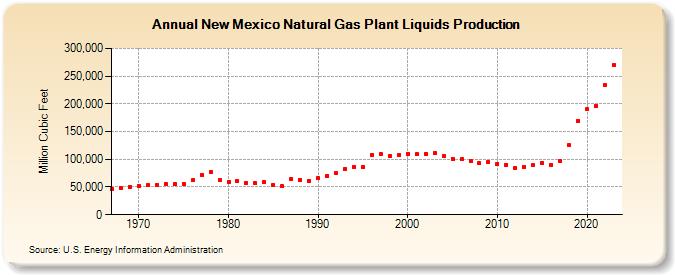
| New Mexico Natural Gas Plant Liquids Production (Million Cubic Feet) | ||||||||
| Decade | Year-0 | Year-1 | Year-2 | Year-3 | Year-4 | Year-5 | Year-6 | Year-7 | Year-8 | Year-9 |
|---|---|---|---|---|---|---|---|---|---|---|
| 1960's | 46,149 | 48,635 | 50,484 | |||||||
| 1970's | 52,647 | 53,810 | 54,157 | 55,782 | 54,986 | 56,109 | 61,778 | 72,484 | 77,653 | 62,107 |
| 1980's | 59,457 | 60,544 | 56,857 | 56,304 | 58,580 | 53,953 | 51,295 | 65,156 | 63,355 | 61,594 |
| 1990's | 66,626 | 70,463 | 75,520 | 83,193 | 86,607 | 85,668 | 108,341 | 109,046 | 106,665 | 107,850 |
| 2000's | 110,411 | 108,958 | 110,036 | 111,292 | 105,412 | 101,064 | 99,971 | 96,250 | 92,579 | 94,840 |
| 2010's | 91,963 | 90,291 | 84,562 | 86,795 | 88,894 | 93,652 | 89,821 | 96,526 | 125,141 | 169,911 |
| 2020's | 189,942 | 196,257 | 233,148 | 269,612 | 270,381 |
| - = No Data Reported; -- = Not Applicable; NA = Not Available; W = Withheld to avoid disclosure of individual company data. |
| Release Date: 6/30/2026 |
| Next Release Date: 7/31/2026 |