|
Download Data (XLS File) |
|
||||||||
|
||||||||
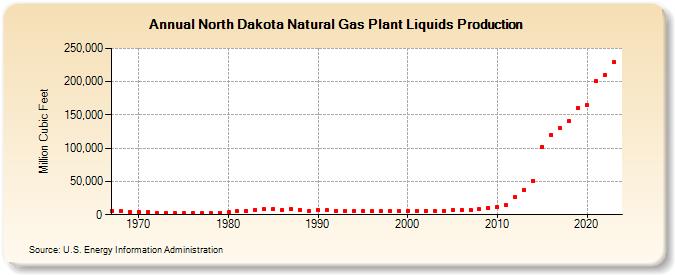
| North Dakota Natural Gas Plant Liquids Production (Million Cubic Feet) | ||||||||
| Decade | Year-0 | Year-1 | Year-2 | Year-3 | Year-4 | Year-5 | Year-6 | Year-7 | Year-8 | Year-9 |
|---|---|---|---|---|---|---|---|---|---|---|
| 1960's | 5,150 | 5,428 | 4,707 | |||||||
| 1970's | 4,490 | 3,592 | 3,199 | 2,969 | 2,571 | 2,404 | 2,421 | 2,257 | 2,394 | 2,986 |
| 1980's | 3,677 | 5,008 | 5,602 | 7,171 | 7,860 | 8,420 | 6,956 | 7,859 | 6,945 | 6,133 |
| 1990's | 6,444 | 6,342 | 6,055 | 5,924 | 5,671 | 5,327 | 4,937 | 5,076 | 5,481 | 5,804 |
| 2000's | 6,021 | 6,168 | 5,996 | 5,818 | 6,233 | 6,858 | 7,254 | 7,438 | 7,878 | 10,140 |
| 2010's | 11,381 | 14,182 | 26,114 | 36,840 | 50,590 | 102,118 | 119,946 | 129,671 | 140,239 | 160,637 |
| 2020's | 164,433 | 200,332 | 210,272 | 227,723 | 237,343 |
| - = No Data Reported; -- = Not Applicable; NA = Not Available; W = Withheld to avoid disclosure of individual company data. |
| Release Date: 6/30/2026 |
| Next Release Date: 7/31/2026 |