|
Download Data (XLS File) |
|
||||||||
|
||||||||
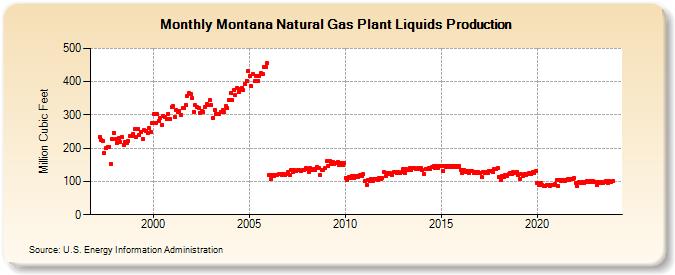
| Montana Natural Gas Plant Liquids Production (Million Cubic Feet) | ||||||||
| Year | Jan | Feb | Mar | Apr | May | Jun | Jul | Aug | Sep | Oct | Nov | Dec |
|---|---|---|---|---|---|---|---|---|---|---|---|---|
| 1997 | 235 | 226 | 221 | 185 | 200 | 204 | 204 | 153 | 228 | 247 | ||
| 1998 | 227 | 215 | 230 | 220 | 234 | 209 | 218 | 216 | 223 | 237 | 237 | 243 |
| 1999 | 257 | 234 | 257 | 240 | 248 | 229 | 254 | 252 | 247 | 261 | 248 | 276 |
| 2000 | 302 | 276 | 302 | 282 | 292 | 270 | 296 | 293 | 288 | 304 | 289 | 323 |
| 2001 | 326 | 294 | 316 | 309 | 312 | 300 | 321 | 320 | 330 | 357 | 365 | 362 |
| 2002 | 350 | 310 | 329 | 323 | 322 | 307 | 312 | 309 | 325 | 332 | 330 | 344 |
| 2003 | 330 | 292 | 316 | 304 | 303 | 303 | 310 | 314 | 308 | 327 | 320 | 344 |
| 2004 | 365 | 345 | 374 | 359 | 382 | 370 | 378 | 381 | 374 | 394 | 403 | 431 |
| 2005 | 418 | 386 | 422 | 401 | 416 | 403 | 417 | 425 | 422 | 445 | 443 | 455 |
| 2006 | 118 | 106 | 120 | 115 | 120 | 118 | 121 | 121 | 118 | 123 | 118 | 123 |
| 2007 | 129 | 118 | 133 | 127 | 134 | 130 | 133 | 134 | 131 | 135 | 134 | 139 |
| 2008 | 136 | 128 | 139 | 134 | 138 | 135 | 142 | 140 | 120 | 135 | 135 | 140 |
| 2009 | 160 | 146 | 160 | 153 | 158 | 153 | 156 | 158 | 148 | 155 | 150 | 154 |
| 2010 | 111 | 103 | 114 | 111 | 115 | 110 | 116 | 117 | 114 | 119 | 116 | 121 |
| 2011 | 102 | 90 | 104 | 102 | 106 | 102 | 106 | 107 | 104 | 110 | 108 | 111 |
| 2012 | 127 | 116 | 125 | 121 | 125 | 120 | 128 | 127 | 124 | 128 | 124 | 127 |
| 2013 | 137 | 125 | 137 | 135 | 139 | 134 | 141 | 141 | 136 | 141 | 138 | 140 |
| 2014 | 134 | 123 | 138 | 136 | 140 | 136 | 144 | 145 | 140 | 146 | 141 | 146 |
| 2015 | 146 | 132 | 147 | 144 | 147 | 142 | 147 | 147 | 143 | 147 | 142 | 146 |
| 2016 | 133 | 126 | 133 | 129 | 131 | 126 | 131 | 130 | 125 | 129 | 126 | 128 |
| 2017 | 124 | 114 | 129 | 125 | 129 | 126 | 132 | 131 | 129 | 136 | 136 | 140 |
| 2018 | 114 | 105 | 117 | 113 | 119 | 115 | 122 | 124 | 122 | 128 | 126 | 129 |
| 2019 | 119 | 108 | 121 | 117 | 122 | 118 | 123 | 126 | 122 | 128 | 126 | 130 |
| 2020 | 95 | 89 | 96 | 90 | 87 | 86 | 90 | 90 | 87 | 89 | 89 | 92 |
| 2021 | 103 | 86 | 104 | 102 | 105 | 101 | 105 | 106 | 103 | 108 | 106 | 110 |
| 2022 | 95 | 86 | 97 | 95 | 98 | 95 | 99 | 100 | 98 | 101 | 98 | 100 |
| 2023 | 103 | 93 | 104 | 100 | 104 | 100 | 104 | 104 | 101 | 105 | 103 | 107 |
| 2024 | 100 | 96 | 100 | 96 | 100 | 98 | 102 | 101 | 97 | 102 | 99 | 104 |
| - = No Data Reported; -- = Not Applicable; NA = Not Available; W = Withheld to avoid disclosure of individual company data. |
| Release Date: 6/30/2026 |
| Next Release Date: 7/31/2026 |