|
Download Data (XLS File) |
|
||||||||
|
||||||||
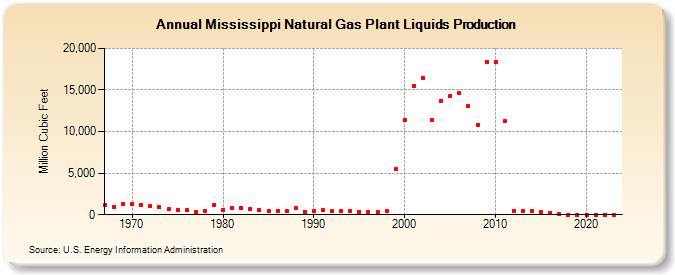
| Mississippi Natural Gas Plant Liquids Production (Million Cubic Feet) | ||||||||
| Decade | Year-0 | Year-1 | Year-2 | Year-3 | Year-4 | Year-5 | Year-6 | Year-7 | Year-8 | Year-9 |
|---|---|---|---|---|---|---|---|---|---|---|
| 1960's | 1,127 | 971 | 1,334 | |||||||
| 1970's | 1,270 | 1,217 | 1,058 | 878 | 679 | 567 | 520 | 367 | 485 | 1,146 |
| 1980's | 553 | 830 | 831 | 633 | 618 | 458 | 463 | 437 | 811 | 380 |
| 1990's | 445 | 511 | 416 | 395 | 425 | 377 | 340 | 300 | 495 | 5,462 |
| 2000's | 11,377 | 15,454 | 16,477 | 11,430 | 13,697 | 14,308 | 14,662 | 13,097 | 10,846 | 18,354 |
| 2010's | 18,405 | 11,221 | 486 | 466 | 495 | 348 | 262 | 32 | 7 | 5 |
| 2020's | 4 | 3 | 1 | 1 | 2 |
| - = No Data Reported; -- = Not Applicable; NA = Not Available; W = Withheld to avoid disclosure of individual company data. |
| Release Date: 6/30/2026 |
| Next Release Date: 7/31/2026 |