|
Download Data (XLS File) |
|
||||||||
|
||||||||
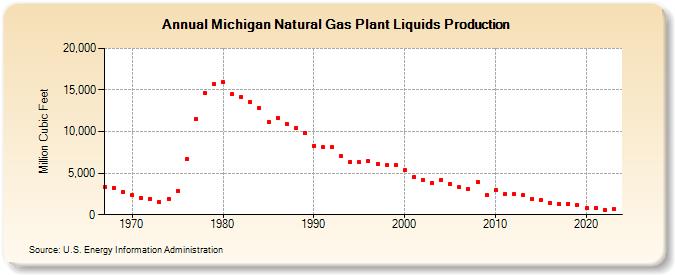
| Michigan Natural Gas Plant Liquids Production (Million Cubic Feet) | ||||||||
| Decade | Year-0 | Year-1 | Year-2 | Year-3 | Year-4 | Year-5 | Year-6 | Year-7 | Year-8 | Year-9 |
|---|---|---|---|---|---|---|---|---|---|---|
| 1960's | 3,351 | 3,244 | 2,705 | |||||||
| 1970's | 2,330 | 2,013 | 1,912 | 1,581 | 1,921 | 2,879 | 6,665 | 11,494 | 14,641 | 15,686 |
| 1980's | 15,933 | 14,540 | 14,182 | 13,537 | 12,829 | 11,129 | 11,644 | 10,876 | 10,483 | 9,886 |
| 1990's | 8,317 | 8,103 | 8,093 | 7,012 | 6,371 | 6,328 | 6,399 | 6,147 | 5,938 | 5,945 |
| 2000's | 5,322 | 4,502 | 4,230 | 3,838 | 4,199 | 3,708 | 3,277 | 3,094 | 3,921 | 2,334 |
| 2010's | 2,943 | 2,465 | 2,480 | 2,345 | 1,922 | 1,793 | 1,450 | 1,279 | 1,340 | 1,118 |
| 2020's | 768 | 849 | 624 | 699 | 656 |
| - = No Data Reported; -- = Not Applicable; NA = Not Available; W = Withheld to avoid disclosure of individual company data. |
| Release Date: 5/29/2026 |
| Next Release Date: 6/30/2026 |