|
Download Data (XLS File) |
|
||||||||
|
||||||||
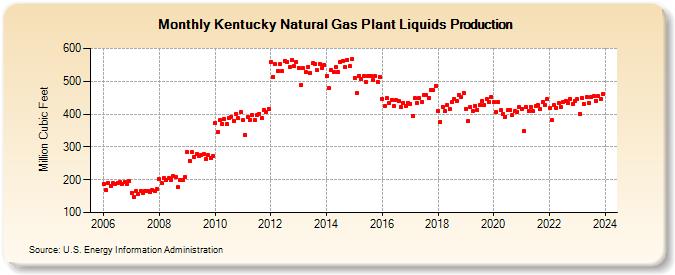
| Kentucky Natural Gas Plant Liquids Production (Million Cubic Feet) | ||||||||
| Year | Jan | Feb | Mar | Apr | May | Jun | Jul | Aug | Sep | Oct | Nov | Dec |
|---|---|---|---|---|---|---|---|---|---|---|---|---|
| 2006 | 187 | 168 | 189 | 182 | 189 | 187 | 191 | 192 | 188 | 194 | 187 | 196 |
| 2007 | 160 | 147 | 165 | 158 | 167 | 161 | 165 | 166 | 162 | 168 | 166 | 172 |
| 2008 | 201 | 189 | 205 | 198 | 204 | 200 | 211 | 208 | 177 | 200 | 200 | 208 |
| 2009 | 283 | 258 | 283 | 269 | 278 | 271 | 276 | 278 | 262 | 274 | 265 | 272 |
| 2010 | 373 | 344 | 381 | 371 | 386 | 369 | 388 | 392 | 380 | 400 | 387 | 406 |
| 2011 | 381 | 337 | 390 | 382 | 396 | 381 | 396 | 401 | 387 | 413 | 405 | 416 |
| 2012 | 559 | 513 | 551 | 531 | 551 | 530 | 562 | 559 | 544 | 564 | 546 | 559 |
| 2013 | 539 | 488 | 539 | 528 | 544 | 525 | 554 | 552 | 533 | 553 | 540 | 549 |
| 2014 | 517 | 478 | 534 | 529 | 544 | 529 | 558 | 561 | 543 | 566 | 545 | 567 |
| 2015 | 511 | 464 | 516 | 507 | 516 | 498 | 516 | 517 | 503 | 516 | 498 | 514 |
| 2016 | 447 | 424 | 448 | 434 | 443 | 425 | 442 | 439 | 422 | 434 | 424 | 433 |
| 2017 | 432 | 395 | 448 | 434 | 448 | 438 | 457 | 457 | 450 | 473 | 472 | 485 |
| 2018 | 409 | 377 | 423 | 408 | 427 | 415 | 438 | 446 | 439 | 459 | 452 | 465 |
| 2019 | 416 | 378 | 421 | 409 | 426 | 413 | 429 | 440 | 427 | 445 | 438 | 452 |
| 2020 | 436 | 407 | 436 | 411 | 399 | 392 | 412 | 411 | 398 | 408 | 407 | 421 |
| 2021 | 416 | 348 | 420 | 410 | 423 | 408 | 425 | 427 | 416 | 436 | 427 | 445 |
| 2022 | 417 | 381 | 428 | 418 | 433 | 420 | 437 | 440 | 433 | 446 | 432 | 440 |
| 2023 | 447 | 402 | 452 | 434 | 452 | 432 | 450 | 453 | 439 | 454 | 446 | 462 |
| 2024 | 439 | 422 | 442 | 423 | 438 | 429 | 449 | 445 | 428 | 448 | 434 | 456 |
| - = No Data Reported; -- = Not Applicable; NA = Not Available; W = Withheld to avoid disclosure of individual company data. |
| Release Date: 6/30/2026 |
| Next Release Date: 7/31/2026 |