|
Download Data (XLS File) |
|
||||||||
|
||||||||
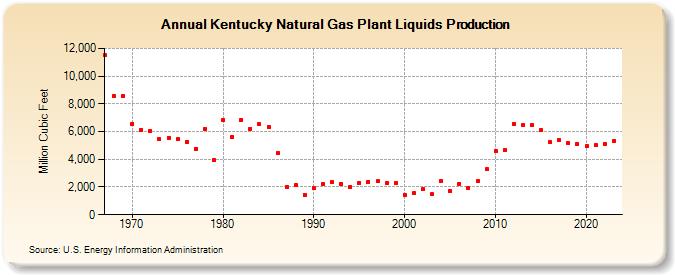
| Kentucky Natural Gas Plant Liquids Production (Million Cubic Feet) | ||||||||
| Decade | Year-0 | Year-1 | Year-2 | Year-3 | Year-4 | Year-5 | Year-6 | Year-7 | Year-8 | Year-9 |
|---|---|---|---|---|---|---|---|---|---|---|
| 1960's | 11,500 | 8,573 | 8,579 | |||||||
| 1970's | 6,574 | 6,133 | 6,063 | 5,441 | 5,557 | 5,454 | 5,231 | 4,764 | 6,192 | 3,923 |
| 1980's | 6,845 | 5,638 | 6,854 | 6,213 | 6,516 | 6,334 | 4,466 | 2,003 | 2,142 | 1,444 |
| 1990's | 1,899 | 2,181 | 2,342 | 2,252 | 2,024 | 2,303 | 2,385 | 2,404 | 2,263 | 2,287 |
| 2000's | 1,416 | 1,558 | 1,836 | 1,463 | 2,413 | 1,716 | 2,252 | 1,957 | 2,401 | 3,270 |
| 2010's | 4,576 | 4,684 | 6,571 | 6,443 | 6,471 | 6,076 | 5,215 | 5,390 | 5,160 | 5,096 |
| 2020's | 4,938 | 5,000 | 5,127 | 5,321 | 5,254 |
| - = No Data Reported; -- = Not Applicable; NA = Not Available; W = Withheld to avoid disclosure of individual company data. |
| Release Date: 6/30/2026 |
| Next Release Date: 7/31/2026 |