|
Download Data (XLS File) |
|
||||||||
|
||||||||
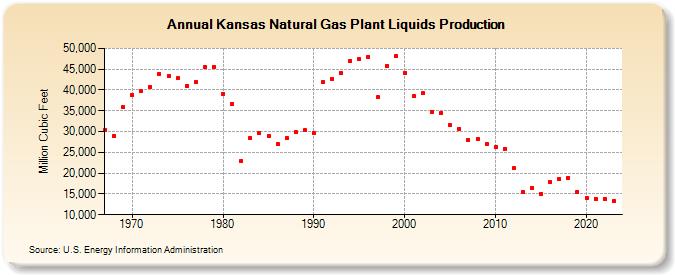
| Kansas Natural Gas Plant Liquids Production (Million Cubic Feet) | ||||||||
| Decade | Year-0 | Year-1 | Year-2 | Year-3 | Year-4 | Year-5 | Year-6 | Year-7 | Year-8 | Year-9 |
|---|---|---|---|---|---|---|---|---|---|---|
| 1960's | 30,480 | 29,042 | 35,813 | |||||||
| 1970's | 38,843 | 39,741 | 40,738 | 43,909 | 43,416 | 42,763 | 40,975 | 41,971 | 45,582 | 45,640 |
| 1980's | 39,130 | 36,653 | 23,023 | 28,561 | 29,707 | 28,964 | 27,050 | 28,397 | 29,800 | 30,273 |
| 1990's | 29,642 | 41,848 | 42,733 | 44,014 | 46,936 | 47,442 | 47,996 | 38,224 | 45,801 | 48,107 |
| 2000's | 44,200 | 38,517 | 39,196 | 34,724 | 34,573 | 31,521 | 30,726 | 28,063 | 28,302 | 26,948 |
| 2010's | 26,251 | 25,804 | 21,220 | 15,446 | 16,515 | 15,056 | 17,905 | 18,621 | 18,841 | 15,481 |
| 2020's | 14,050 | 13,865 | 13,890 | 13,322 | 10,342 |
| - = No Data Reported; -- = Not Applicable; NA = Not Available; W = Withheld to avoid disclosure of individual company data. |
| Release Date: 6/30/2026 |
| Next Release Date: 7/31/2026 |