|
Download Data (XLS File) |
|
||||||||
|
||||||||
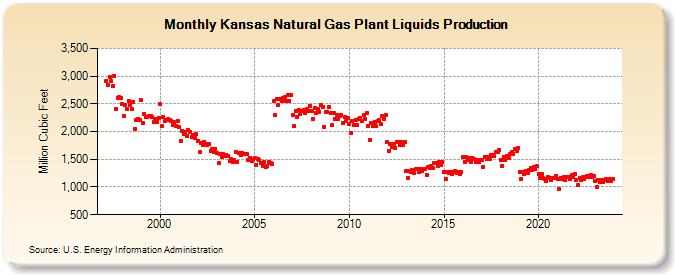
| Kansas Natural Gas Plant Liquids Production (Million Cubic Feet) | ||||||||
| Year | Jan | Feb | Mar | Apr | May | Jun | Jul | Aug | Sep | Oct | Nov | Dec |
|---|---|---|---|---|---|---|---|---|---|---|---|---|
| 1997 | 2,915 | 2,831 | 2,991 | 2,910 | 2,825 | 3,005 | 2,409 | 2,611 | 2,627 | 2,611 | ||
| 1998 | 2,491 | 2,288 | 2,487 | 2,415 | 2,553 | 2,483 | 2,411 | 2,540 | 2,040 | 2,211 | 2,225 | 2,212 |
| 1999 | 2,564 | 2,151 | 2,322 | 2,254 | 2,266 | 2,281 | 2,272 | 2,254 | 2,175 | 2,227 | 2,165 | 2,246 |
| 2000 | 2,494 | 2,092 | 2,259 | 2,192 | 2,204 | 2,219 | 2,209 | 2,192 | 2,116 | 2,166 | 2,106 | 2,185 |
| 2001 | 2,076 | 1,834 | 2,015 | 1,959 | 1,986 | 1,924 | 2,020 | 1,998 | 1,904 | 1,945 | 1,886 | 1,953 |
| 2002 | 1,831 | 1,631 | 1,796 | 1,764 | 1,809 | 1,775 | 1,763 | 1,769 | 1,653 | 1,693 | 1,640 | 1,694 |
| 2003 | 1,605 | 1,431 | 1,594 | 1,549 | 1,593 | 1,566 | 1,576 | 1,567 | 1,463 | 1,498 | 1,444 | 1,481 |
| 2004 | 1,634 | 1,457 | 1,622 | 1,577 | 1,621 | 1,594 | 1,604 | 1,595 | 1,489 | 1,524 | 1,470 | 1,507 |
| 2005 | 1,522 | 1,393 | 1,504 | 1,481 | 1,431 | 1,384 | 1,453 | 1,352 | 1,374 | 1,457 | 1,425 | 1,423 |
| 2006 | 2,550 | 2,297 | 2,583 | 2,486 | 2,584 | 2,555 | 2,612 | 2,622 | 2,560 | 2,652 | 2,557 | 2,667 |
| 2007 | 2,296 | 2,103 | 2,366 | 2,260 | 2,393 | 2,316 | 2,367 | 2,380 | 2,327 | 2,409 | 2,379 | 2,467 |
| 2008 | 2,367 | 2,234 | 2,418 | 2,333 | 2,410 | 2,361 | 2,484 | 2,448 | 2,090 | 2,352 | 2,357 | 2,449 |
| 2009 | 2,328 | 2,122 | 2,334 | 2,220 | 2,295 | 2,231 | 2,275 | 2,293 | 2,159 | 2,259 | 2,188 | 2,244 |
| 2010 | 2,139 | 1,974 | 2,187 | 2,127 | 2,213 | 2,114 | 2,224 | 2,250 | 2,183 | 2,294 | 2,220 | 2,327 |
| 2011 | 2,096 | 1,856 | 2,150 | 2,105 | 2,180 | 2,098 | 2,182 | 2,208 | 2,133 | 2,275 | 2,229 | 2,292 |
| 2012 | 1,807 | 1,657 | 1,778 | 1,716 | 1,780 | 1,712 | 1,815 | 1,806 | 1,758 | 1,820 | 1,764 | 1,807 |
| 2013 | 1,291 | 1,169 | 1,291 | 1,266 | 1,303 | 1,259 | 1,327 | 1,324 | 1,278 | 1,325 | 1,295 | 1,316 |
| 2014 | 1,321 | 1,221 | 1,362 | 1,350 | 1,387 | 1,350 | 1,424 | 1,432 | 1,385 | 1,446 | 1,390 | 1,448 |
| 2015 | 1,267 | 1,150 | 1,278 | 1,255 | 1,278 | 1,234 | 1,279 | 1,281 | 1,247 | 1,279 | 1,233 | 1,274 |
| 2016 | 1,535 | 1,457 | 1,540 | 1,489 | 1,521 | 1,458 | 1,519 | 1,507 | 1,448 | 1,491 | 1,455 | 1,486 |
| 2017 | 1,492 | 1,366 | 1,547 | 1,499 | 1,549 | 1,513 | 1,580 | 1,579 | 1,555 | 1,635 | 1,632 | 1,676 |
| 2018 | 1,495 | 1,378 | 1,544 | 1,491 | 1,559 | 1,516 | 1,598 | 1,630 | 1,603 | 1,678 | 1,652 | 1,699 |
| 2019 | 1,264 | 1,149 | 1,278 | 1,243 | 1,294 | 1,256 | 1,305 | 1,336 | 1,298 | 1,353 | 1,331 | 1,374 |
| 2020 | 1,240 | 1,158 | 1,240 | 1,169 | 1,136 | 1,115 | 1,173 | 1,169 | 1,132 | 1,161 | 1,158 | 1,199 |
| 2021 | 1,153 | 964 | 1,165 | 1,136 | 1,173 | 1,131 | 1,180 | 1,183 | 1,153 | 1,210 | 1,184 | 1,234 |
| 2022 | 1,131 | 1,031 | 1,160 | 1,134 | 1,172 | 1,138 | 1,185 | 1,193 | 1,172 | 1,209 | 1,172 | 1,193 |
| 2023 | 1,119 | 1,007 | 1,131 | 1,085 | 1,131 | 1,082 | 1,126 | 1,133 | 1,099 | 1,137 | 1,117 | 1,155 |
| 2024 | 865 | 831 | 869 | 834 | 863 | 845 | 884 | 876 | 842 | 882 | 854 | 898 |
| - = No Data Reported; -- = Not Applicable; NA = Not Available; W = Withheld to avoid disclosure of individual company data. |
| Release Date: 6/30/2026 |
| Next Release Date: 7/31/2026 |