|
Download Data (XLS File) |
|
||||||||
|
||||||||
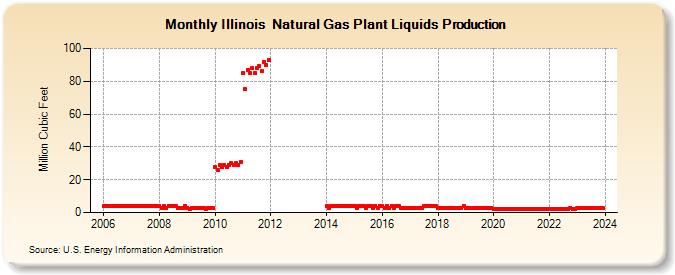
| Illinois Natural Gas Plant Liquids Production (Million Cubic Feet) | ||||||||
| Year | Jan | Feb | Mar | Apr | May | Jun | Jul | Aug | Sep | Oct | Nov | Dec |
|---|---|---|---|---|---|---|---|---|---|---|---|---|
| 2006 | 4 | 4 | 4 | 4 | 4 | 4 | 4 | 4 | 4 | 4 | 4 | 4 |
| 2007 | 4 | 4 | 4 | 4 | 4 | 4 | 4 | 4 | 4 | 4 | 4 | 4 |
| 2008 | 4 | 3 | 4 | 3 | 4 | 4 | 4 | 4 | 3 | 3 | 3 | 4 |
| 2009 | 3 | 2 | 3 | 3 | 3 | 3 | 3 | 3 | 2 | 3 | 3 | 3 |
| 2010 | 28 | 26 | 29 | 28 | 29 | 28 | 29 | 30 | 29 | 30 | 29 | 31 |
| 2011 | 85 | 75 | 87 | 85 | 88 | 85 | 88 | 89 | 86 | 92 | 90 | 93 |
| 2014 | 4 | 3 | 4 | 4 | 4 | 4 | 4 | 4 | 4 | 4 | 4 | 4 |
| 2015 | 4 | 3 | 4 | 4 | 4 | 3 | 4 | 4 | 3 | 4 | 3 | 4 |
| 2016 | 4 | 3 | 4 | 3 | 4 | 3 | 4 | 4 | 3 | 3 | 3 | 3 |
| 2017 | 3 | 3 | 3 | 3 | 3 | 3 | 4 | 4 | 4 | 4 | 4 | 4 |
| 2018 | 3 | 3 | 3 | 3 | 3 | 3 | 3 | 3 | 3 | 3 | 3 | 4 |
| 2019 | 3 | 3 | 3 | 3 | 3 | 3 | 3 | 3 | 3 | 3 | 3 | 3 |
| 2020 | 2 | 2 | 2 | 2 | 2 | 2 | 2 | 2 | 2 | 2 | 2 | 2 |
| 2021 | 2 | 2 | 2 | 2 | 2 | 2 | 2 | 2 | 2 | 2 | 2 | 2 |
| 2022 | 2 | 2 | 2 | 2 | 2 | 2 | 2 | 2 | 2 | 3 | 2 | 2 |
| 2023 | 3 | 3 | 3 | 3 | 3 | 3 | 3 | 3 | 3 | 3 | 3 | 3 |
| 2024 | 2 | 2 | 2 | 2 | 2 | 2 | 2 | 2 | 2 | 2 | 2 | 2 |
| - = No Data Reported; -- = Not Applicable; NA = Not Available; W = Withheld to avoid disclosure of individual company data. |
| Release Date: 6/30/2026 |
| Next Release Date: 7/31/2026 |