|
Download Data (XLS File) |
|
||||||||
|
||||||||
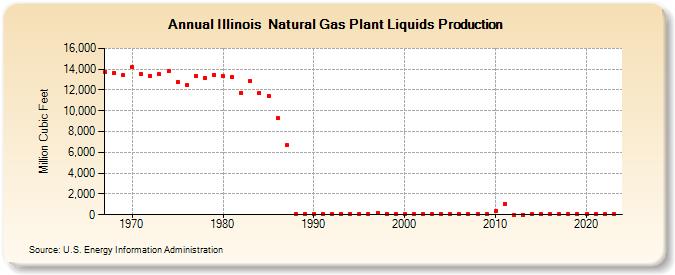
| Illinois Natural Gas Plant Liquids Production (Million Cubic Feet) | ||||||||
| Decade | Year-0 | Year-1 | Year-2 | Year-3 | Year-4 | Year-5 | Year-6 | Year-7 | Year-8 | Year-9 |
|---|---|---|---|---|---|---|---|---|---|---|
| 1960's | 13,725 | 13,657 | 13,425 | |||||||
| 1970's | 14,165 | 13,520 | 13,346 | 13,534 | 13,821 | 12,785 | 12,477 | 13,310 | 13,173 | 13,484 |
| 1980's | 13,340 | 13,264 | 11,741 | 12,843 | 11,687 | 11,436 | 9,259 | 6,662 | 61 | 81 |
| 1990's | 81 | 100 | 100 | 86 | 80 | 77 | 64 | 200 | 70 | 55 |
| 2000's | 42 | 35 | 47 | 48 | 49 | 46 | 47 | 48 | 42 | 31 |
| 2010's | 345 | 1,043 | 0 | 0 | 47 | 42 | 42 | 42 | 39 | 38 |
| 2020's | 28 | 28 | 29 | 34 | 27 |
| - = No Data Reported; -- = Not Applicable; NA = Not Available; W = Withheld to avoid disclosure of individual company data. |
| Release Date: 3/31/2026 |
| Next Release Date: 4/30/2026 |