|
Download Data (XLS File) |
|
||||||||
|
||||||||
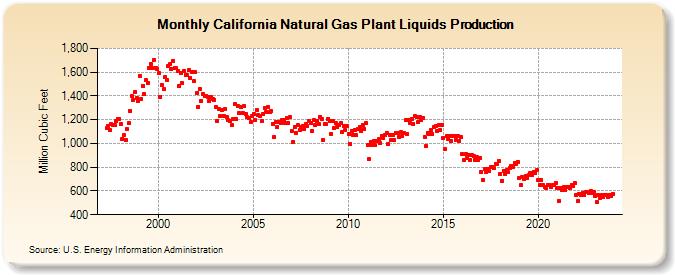
| California Natural Gas Plant Liquids Production (Million Cubic Feet) | ||||||||
| Year | Jan | Feb | Mar | Apr | May | Jun | Jul | Aug | Sep | Oct | Nov | Dec |
|---|---|---|---|---|---|---|---|---|---|---|---|---|
| 1997 | 1,128 | 1,144 | 1,112 | 1,163 | 1,157 | 1,153 | 1,185 | 1,203 | 1,208 | |||
| 1998 | 1,163 | 1,041 | 1,067 | 1,031 | 1,123 | 1,168 | 1,276 | 1,397 | 1,368 | 1,431 | 1,386 | 1,361 |
| 1999 | 1,570 | 1,373 | 1,484 | 1,415 | 1,531 | 1,512 | 1,638 | 1,672 | 1,634 | 1,703 | 1,639 | 1,625 |
| 2000 | 1,592 | 1,391 | 1,494 | 1,457 | 1,558 | 1,536 | 1,650 | 1,665 | 1,628 | 1,696 | 1,636 | 1,632 |
| 2001 | 1,613 | 1,482 | 1,594 | 1,507 | 1,610 | 1,578 | 1,573 | 1,617 | 1,553 | 1,601 | 1,523 | 1,601 |
| 2002 | 1,428 | 1,309 | 1,458 | 1,358 | 1,413 | 1,397 | 1,398 | 1,391 | 1,359 | 1,395 | 1,376 | 1,368 |
| 2003 | 1,306 | 1,185 | 1,287 | 1,231 | 1,284 | 1,235 | 1,288 | 1,224 | 1,198 | 1,193 | 1,153 | 1,204 |
| 2004 | 1,329 | 1,205 | 1,311 | 1,252 | 1,309 | 1,258 | 1,312 | 1,247 | 1,219 | 1,215 | 1,177 | 1,227 |
| 2005 | 1,248 | 1,199 | 1,284 | 1,237 | 1,235 | 1,188 | 1,246 | 1,301 | 1,268 | 1,303 | 1,263 | 1,273 |
| 2006 | 1,167 | 1,051 | 1,181 | 1,137 | 1,182 | 1,169 | 1,195 | 1,199 | 1,171 | 1,213 | 1,170 | 1,220 |
| 2007 | 1,106 | 1,013 | 1,140 | 1,089 | 1,153 | 1,116 | 1,140 | 1,147 | 1,121 | 1,160 | 1,146 | 1,188 |
| 2008 | 1,168 | 1,103 | 1,194 | 1,152 | 1,190 | 1,165 | 1,226 | 1,209 | 1,032 | 1,161 | 1,163 | 1,209 |
| 2009 | 1,186 | 1,081 | 1,189 | 1,130 | 1,168 | 1,136 | 1,159 | 1,168 | 1,099 | 1,150 | 1,114 | 1,143 |
| 2010 | 1,079 | 996 | 1,103 | 1,073 | 1,116 | 1,067 | 1,122 | 1,135 | 1,101 | 1,157 | 1,120 | 1,174 |
| 2011 | 983 | 870 | 1,008 | 987 | 1,022 | 983 | 1,023 | 1,035 | 1,000 | 1,066 | 1,045 | 1,074 |
| 2012 | 1,086 | 996 | 1,069 | 1,031 | 1,070 | 1,029 | 1,091 | 1,086 | 1,057 | 1,094 | 1,060 | 1,086 |
| 2013 | 1,195 | 1,082 | 1,195 | 1,172 | 1,207 | 1,166 | 1,229 | 1,226 | 1,183 | 1,226 | 1,199 | 1,218 |
| 2014 | 1,056 | 976 | 1,088 | 1,079 | 1,109 | 1,079 | 1,138 | 1,145 | 1,107 | 1,156 | 1,111 | 1,157 |
| 2015 | 1,049 | 952 | 1,059 | 1,040 | 1,059 | 1,022 | 1,060 | 1,061 | 1,033 | 1,060 | 1,021 | 1,055 |
| 2016 | 909 | 862 | 911 | 881 | 900 | 863 | 899 | 892 | 857 | 882 | 861 | 880 |
| 2017 | 758 | 694 | 786 | 762 | 787 | 769 | 803 | 803 | 790 | 831 | 829 | 852 |
| 2018 | 745 | 687 | 770 | 744 | 777 | 756 | 797 | 813 | 800 | 837 | 824 | 847 |
| 2019 | 713 | 648 | 721 | 701 | 730 | 708 | 736 | 754 | 732 | 763 | 751 | 775 |
| 2020 | 692 | 646 | 692 | 652 | 634 | 622 | 654 | 652 | 632 | 648 | 646 | 669 |
| 2021 | 621 | 519 | 627 | 612 | 632 | 609 | 635 | 637 | 621 | 652 | 638 | 665 |
| 2022 | 563 | 513 | 578 | 564 | 584 | 566 | 590 | 594 | 584 | 602 | 583 | 594 |
| 2023 | 562 | 505 | 567 | 544 | 567 | 543 | 565 | 568 | 551 | 570 | 560 | 580 |
| 2024 | 504 | 485 | 507 | 486 | 503 | 493 | 516 | 511 | 491 | 514 | 498 | 524 |
| - = No Data Reported; -- = Not Applicable; NA = Not Available; W = Withheld to avoid disclosure of individual company data. |
| Release Date: 6/30/2026 |
| Next Release Date: 7/31/2026 |