|
Download Data (XLS File) |
|
||||||||
|
||||||||
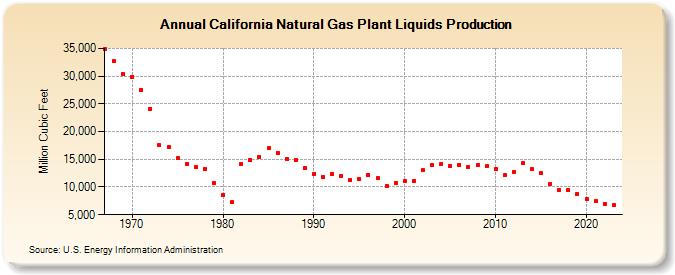
| California Natural Gas Plant Liquids Production (Million Cubic Feet) | ||||||||
| Decade | Year-0 | Year-1 | Year-2 | Year-3 | Year-4 | Year-5 | Year-6 | Year-7 | Year-8 | Year-9 |
|---|---|---|---|---|---|---|---|---|---|---|
| 1960's | 34,803 | 32,639 | 30,334 | |||||||
| 1970's | 29,901 | 27,585 | 24,156 | 17,498 | 17,201 | 15,221 | 14,125 | 13,567 | 13,288 | 10,720 |
| 1980's | 8,583 | 7,278 | 14,113 | 14,943 | 15,442 | 16,973 | 16,203 | 15,002 | 14,892 | 13,376 |
| 1990's | 12,424 | 11,786 | 12,385 | 12,053 | 11,250 | 11,509 | 12,169 | 11,600 | 10,242 | 10,762 |
| 2000's | 11,063 | 11,060 | 12,982 | 13,971 | 14,061 | 13,748 | 14,056 | 13,521 | 13,972 | 13,722 |
| 2010's | 13,244 | 12,095 | 12,755 | 14,298 | 13,201 | 12,470 | 10,597 | 9,465 | 9,397 | 8,733 |
| 2020's | 7,838 | 7,468 | 6,915 | 6,683 | 6,032 |
| - = No Data Reported; -- = Not Applicable; NA = Not Available; W = Withheld to avoid disclosure of individual company data. |
| Release Date: 5/29/2026 |
| Next Release Date: 6/30/2026 |