|
Download Data (XLS File) |
|
||||||||
|
||||||||
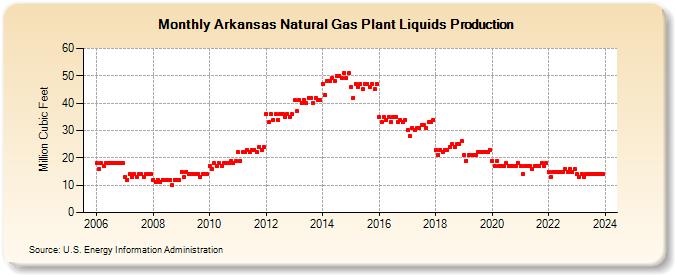
| Arkansas Natural Gas Plant Liquids Production (Million Cubic Feet) | ||||||||
| Year | Jan | Feb | Mar | Apr | May | Jun | Jul | Aug | Sep | Oct | Nov | Dec |
|---|---|---|---|---|---|---|---|---|---|---|---|---|
| 2006 | 18 | 16 | 18 | 17 | 18 | 18 | 18 | 18 | 18 | 18 | 18 | 18 |
| 2007 | 13 | 12 | 14 | 13 | 14 | 13 | 14 | 14 | 13 | 14 | 14 | 14 |
| 2008 | 12 | 11 | 12 | 11 | 12 | 12 | 12 | 12 | 10 | 12 | 12 | 12 |
| 2009 | 15 | 13 | 15 | 14 | 14 | 14 | 14 | 14 | 13 | 14 | 14 | 14 |
| 2010 | 17 | 16 | 18 | 17 | 18 | 17 | 18 | 18 | 18 | 19 | 18 | 19 |
| 2011 | 22 | 19 | 22 | 22 | 23 | 22 | 23 | 23 | 22 | 24 | 23 | 24 |
| 2012 | 36 | 33 | 36 | 34 | 36 | 34 | 36 | 36 | 35 | 36 | 35 | 36 |
| 2013 | 41 | 37 | 41 | 40 | 41 | 40 | 42 | 42 | 40 | 42 | 41 | 41 |
| 2014 | 47 | 43 | 48 | 48 | 49 | 48 | 50 | 50 | 49 | 51 | 49 | 51 |
| 2015 | 46 | 42 | 47 | 46 | 47 | 45 | 47 | 47 | 46 | 47 | 45 | 47 |
| 2016 | 35 | 33 | 35 | 34 | 35 | 33 | 35 | 35 | 33 | 34 | 33 | 34 |
| 2017 | 30 | 28 | 31 | 30 | 31 | 31 | 32 | 32 | 31 | 33 | 33 | 34 |
| 2018 | 23 | 21 | 23 | 22 | 23 | 23 | 24 | 25 | 24 | 25 | 25 | 26 |
| 2019 | 21 | 19 | 21 | 21 | 21 | 21 | 22 | 22 | 22 | 22 | 22 | 23 |
| 2020 | 19 | 17 | 19 | 17 | 17 | 17 | 18 | 17 | 17 | 17 | 17 | 18 |
| 2021 | 17 | 14 | 17 | 17 | 17 | 16 | 17 | 17 | 17 | 18 | 17 | 18 |
| 2022 | 15 | 13 | 15 | 15 | 15 | 15 | 15 | 16 | 15 | 16 | 15 | 16 |
| 2023 | 14 | 13 | 14 | 14 | 14 | 13 | 14 | 14 | 14 | 14 | 14 | 14 |
| 2024 | 12 | 11 | 12 | 11 | 12 | 11 | 12 | 12 | 11 | 12 | 11 | 12 |
| - = No Data Reported; -- = Not Applicable; NA = Not Available; W = Withheld to avoid disclosure of individual company data. |
| Release Date: 6/30/2026 |
| Next Release Date: 7/31/2026 |