|
Download Data (XLS File) |
|
||||||||
|
||||||||
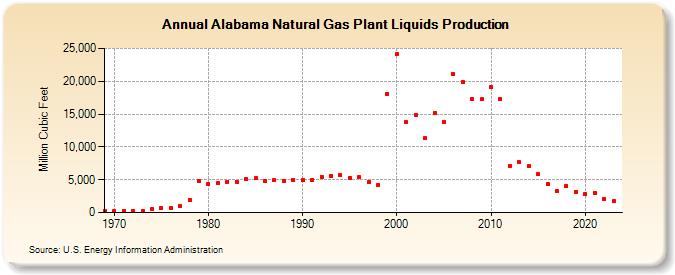
| Alabama Natural Gas Plant Liquids Production (Million Cubic Feet) | ||||||||
| Decade | Year-0 | Year-1 | Year-2 | Year-3 | Year-4 | Year-5 | Year-6 | Year-7 | Year-8 | Year-9 |
|---|---|---|---|---|---|---|---|---|---|---|
| 1960's | 236 | |||||||||
| 1970's | 225 | 281 | 243 | 199 | 501 | 694 | 661 | 933 | 1,967 | 4,845 |
| 1980's | 4,371 | 4,484 | 4,727 | 4,709 | 5,123 | 5,236 | 4,836 | 4,887 | 4,774 | 5,022 |
| 1990's | 4,939 | 4,997 | 5,490 | 5,589 | 5,647 | 5,273 | 5,361 | 4,637 | 4,263 | 18,079 |
| 2000's | 24,086 | 13,754 | 14,826 | 11,293 | 15,133 | 13,759 | 21,065 | 19,831 | 17,222 | 17,232 |
| 2010's | 19,059 | 17,271 | 7,133 | 7,675 | 7,044 | 5,813 | 4,274 | 3,220 | 4,047 | 3,190 |
| 2020's | 2,795 | 3,048 | 2,019 | 1,686 | 1,906 |
| - = No Data Reported; -- = Not Applicable; NA = Not Available; W = Withheld to avoid disclosure of individual company data. |
| Release Date: 6/30/2026 |
| Next Release Date: 7/31/2026 |