|
Download Data (XLS File) |
|
||||||||
|
||||||||
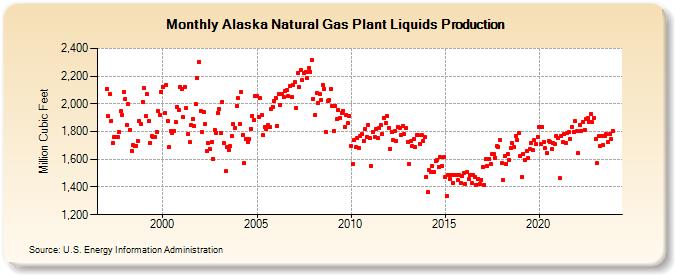
| Alaska Natural Gas Plant Liquids Production (Million Cubic Feet) | ||||||||
| Year | Jan | Feb | Mar | Apr | May | Jun | Jul | Aug | Sep | Oct | Nov | Dec |
|---|---|---|---|---|---|---|---|---|---|---|---|---|
| 1997 | 2,110 | 1,911 | 2,068 | 1,877 | 1,719 | 1,763 | 1,760 | 1,759 | 1,797 | 1,945 | 1,922 | 2,087 |
| 1998 | 2,038 | 1,844 | 1,996 | 1,811 | 1,657 | 1,701 | 1,699 | 1,697 | 1,733 | 1,877 | 1,855 | 2,015 |
| 1999 | 2,112 | 1,912 | 2,069 | 1,878 | 1,721 | 1,765 | 1,763 | 1,761 | 1,799 | 1,946 | 1,923 | 2,088 |
| 2000 | 2,124 | 1,932 | 2,137 | 1,875 | 1,686 | 1,805 | 1,788 | 1,806 | 1,868 | 1,979 | 1,956 | 2,124 |
| 2001 | 2,110 | 1,904 | 2,124 | 1,967 | 1,783 | 1,722 | 1,847 | 1,891 | 1,838 | 1,997 | 2,185 | 2,303 |
| 2002 | 1,951 | 1,799 | 1,939 | 1,851 | 1,659 | 1,714 | 1,675 | 1,725 | 1,605 | 1,814 | 1,793 | 1,933 |
| 2003 | 1,962 | 1,790 | 2,016 | 1,714 | 1,512 | 1,691 | 1,664 | 1,693 | 1,769 | 1,853 | 1,827 | 1,983 |
| 2004 | 2,039 | 1,852 | 2,082 | 1,778 | 1,573 | 1,748 | 1,725 | 1,745 | 1,821 | 1,912 | 1,885 | 2,053 |
| 2005 | 2,055 | 1,908 | 2,039 | 1,920 | 1,772 | 1,834 | 1,822 | 1,845 | 1,832 | 1,962 | 1,980 | 2,019 |
| 2006 | 2,045 | 1,842 | 2,071 | 1,994 | 2,072 | 2,049 | 2,095 | 2,102 | 2,053 | 2,127 | 2,050 | 2,139 |
| 2007 | 2,154 | 1,973 | 2,220 | 2,121 | 2,246 | 2,173 | 2,221 | 2,233 | 2,184 | 2,260 | 2,233 | 2,315 |
| 2008 | 2,035 | 1,921 | 2,080 | 2,006 | 2,073 | 2,030 | 2,136 | 2,105 | 1,797 | 2,022 | 2,026 | 2,106 |
| 2009 | 1,981 | 1,805 | 1,986 | 1,888 | 1,952 | 1,898 | 1,936 | 1,951 | 1,836 | 1,922 | 1,861 | 1,909 |
| 2010 | 1,698 | 1,567 | 1,736 | 1,688 | 1,756 | 1,678 | 1,765 | 1,785 | 1,732 | 1,821 | 1,762 | 1,847 |
| 2011 | 1,751 | 1,550 | 1,796 | 1,758 | 1,821 | 1,753 | 1,823 | 1,844 | 1,782 | 1,900 | 1,862 | 1,914 |
| 2012 | 1,828 | 1,677 | 1,799 | 1,736 | 1,801 | 1,732 | 1,836 | 1,827 | 1,778 | 1,842 | 1,785 | 1,828 |
| 2013 | 1,728 | 1,566 | 1,729 | 1,694 | 1,745 | 1,686 | 1,777 | 1,773 | 1,711 | 1,774 | 1,734 | 1,762 |
| 2014 | 1,474 | 1,363 | 1,520 | 1,507 | 1,549 | 1,506 | 1,590 | 1,598 | 1,546 | 1,614 | 1,552 | 1,616 |
| 2015 | 1,469 | 1,334 | 1,483 | 1,456 | 1,483 | 1,432 | 1,484 | 1,486 | 1,447 | 1,484 | 1,431 | 1,478 |
| 2016 | 1,502 | 1,425 | 1,506 | 1,457 | 1,488 | 1,426 | 1,486 | 1,474 | 1,417 | 1,458 | 1,423 | 1,454 |
| 2017 | 1,546 | 1,416 | 1,603 | 1,554 | 1,605 | 1,569 | 1,638 | 1,637 | 1,612 | 1,695 | 1,691 | 1,737 |
| 2018 | 1,572 | 1,450 | 1,624 | 1,569 | 1,640 | 1,595 | 1,681 | 1,715 | 1,687 | 1,765 | 1,738 | 1,787 |
| 2019 | 1,621 | 1,474 | 1,639 | 1,594 | 1,660 | 1,611 | 1,674 | 1,714 | 1,665 | 1,736 | 1,707 | 1,762 |
| 2020 | 1,831 | 1,711 | 1,833 | 1,727 | 1,678 | 1,647 | 1,732 | 1,727 | 1,673 | 1,715 | 1,711 | 1,771 |
| 2021 | 1,750 | 1,464 | 1,767 | 1,724 | 1,780 | 1,716 | 1,790 | 1,796 | 1,749 | 1,836 | 1,797 | 1,873 |
| 2022 | 1,801 | 1,642 | 1,848 | 1,806 | 1,868 | 1,813 | 1,888 | 1,901 | 1,868 | 1,927 | 1,867 | 1,901 |
| 2023 | 1,752 | 1,576 | 1,770 | 1,699 | 1,770 | 1,693 | 1,762 | 1,773 | 1,719 | 1,779 | 1,748 | 1,808 |
| 2024 | 1,760 | 1,692 | 1,769 | 1,696 | 1,755 | 1,719 | 1,799 | 1,782 | 1,713 | 1,794 | 1,737 | 1,827 |
| - = No Data Reported; -- = Not Applicable; NA = Not Available; W = Withheld to avoid disclosure of individual company data. |
| Release Date: 6/30/2026 |
| Next Release Date: 7/31/2026 |