|
Download Data (XLS File) |
|
||||||||
|
||||||||
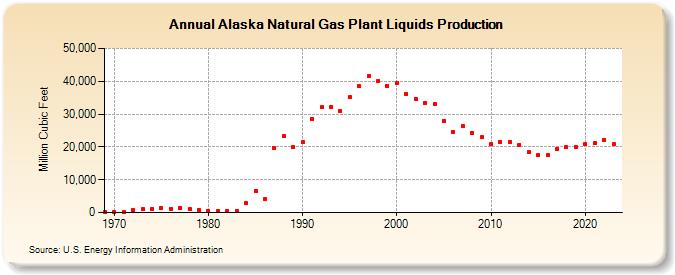
| Alaska Natural Gas Plant Liquids Production (Million Cubic Feet) | ||||||||
| Decade | Year-0 | Year-1 | Year-2 | Year-3 | Year-4 | Year-5 | Year-6 | Year-7 | Year-8 | Year-9 |
|---|---|---|---|---|---|---|---|---|---|---|
| 1960's | 188 | |||||||||
| 1970's | 264 | 99 | 749 | 986 | 1,097 | 1,244 | 1,229 | 1,321 | 954 | 701 |
| 1980's | 483 | 529 | 468 | 440 | 2,849 | 6,703 | 4,206 | 19,590 | 23,240 | 19,932 |
| 1990's | 21,476 | 28,440 | 32,004 | 32,257 | 30,945 | 35,052 | 38,453 | 41,535 | 40,120 | 38,412 |
| 2000's | 39,324 | 36,149 | 34,706 | 33,316 | 33,044 | 27,956 | 24,638 | 26,332 | 24,337 | 22,925 |
| 2010's | 20,835 | 21,554 | 21,470 | 20,679 | 18,434 | 17,468 | 17,516 | 19,303 | 19,821 | 19,857 |
| 2020's | 20,756 | 21,043 | 22,130 | 20,848 | 21,043 |
| - = No Data Reported; -- = Not Applicable; NA = Not Available; W = Withheld to avoid disclosure of individual company data. |
| Release Date: 6/30/2026 |
| Next Release Date: 7/31/2026 |