|
Download Data (XLS File) |
|
|||||
|
|||||
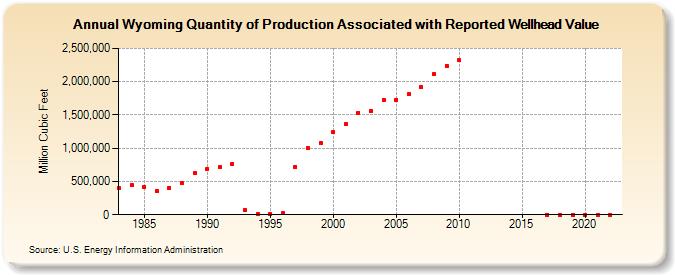
| Wyoming Quantity of Production Associated with Reported Wellhead Value (Million Cubic Feet) | |||||
| Decade | Year-0 | Year-1 | Year-2 | Year-3 | Year-4 | Year-5 | Year-6 | Year-7 | Year-8 | Year-9 |
|---|---|---|---|---|---|---|---|---|---|---|
| 1980's | 395,656 | 447,615 | 416,565 | 352,858 | 407,863 | 471,095 | 623,915 | |||
| 1990's | 690,356 | 711,799 | 765,254 | 63,667 | 14,283 | 12,449 | 27,821 | 719,933 | 1,004,020 | 1,079,375 |
| 2000's | 1,240,038 | 1,359,868 | 1,533,724 | 1,561,322 | 1,724,725 | 1,729,760 | 1,811,992 | 1,916,238 | 2,116,818 | 2,239,778 |
| 2010's | 2,318,486 | 0 | 0 | 0 | ||||||
| 2020's | 0 | 0 | 0 | 0 |
| - = No Data Reported; -- = Not Applicable; NA = Not Available; W = Withheld to avoid disclosure of individual company data. |
| Release Date: 6/30/2026 |
| Next Release Date: 7/31/2026 |