|
Download Data (XLS File) |
|
|||||
|
|||||
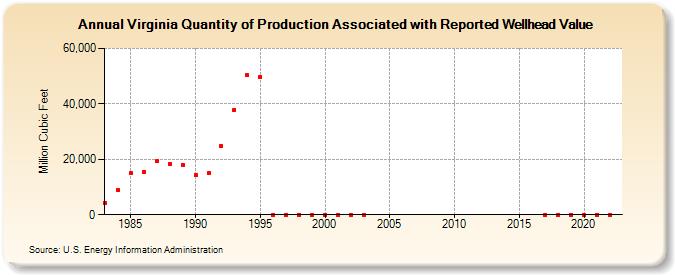
| Virginia Quantity of Production Associated with Reported Wellhead Value (Million Cubic Feet) | |||||
| Decade | Year-0 | Year-1 | Year-2 | Year-3 | Year-4 | Year-5 | Year-6 | Year-7 | Year-8 | Year-9 |
|---|---|---|---|---|---|---|---|---|---|---|
| 1980's | 4,342 | 8,928 | 15,041 | 15,427 | 19,223 | 18,424 | 17,935 | |||
| 1990's | 14,283 | 14,906 | 24,734 | 37,840 | 50,259 | 49,818 | 0 | 0 | 0 | 0 |
| 2000's | 0 | 0 | 0 | 0 | NA | NA | NA | NA | NA | NA |
| 2010's | NA | 0 | 0 | 0 | ||||||
| 2020's | 0 | 0 | 0 | 0 |
| - = No Data Reported; -- = Not Applicable; NA = Not Available; W = Withheld to avoid disclosure of individual company data. |
| Release Date: 6/30/2026 |
| Next Release Date: 7/31/2026 |