|
Download Data (XLS File) |
|
|||||
|
|||||
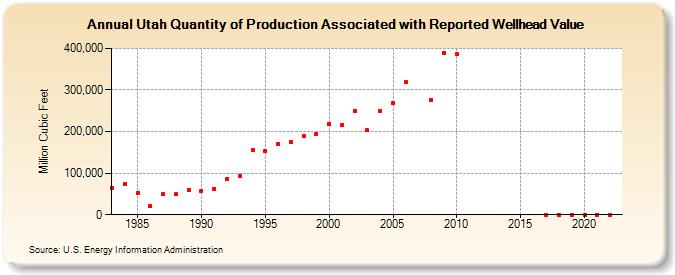
| Utah Quantity of Production Associated with Reported Wellhead Value (Million Cubic Feet) | |||||
| Decade | Year-0 | Year-1 | Year-2 | Year-3 | Year-4 | Year-5 | Year-6 | Year-7 | Year-8 | Year-9 |
|---|---|---|---|---|---|---|---|---|---|---|
| 1980's | 63,158 | 74,698 | 52,324 | 21,491 | 48,654 | 49,378 | 58,356 | |||
| 1990's | 57,098 | 62,241 | 86,682 | 93,894 | 154,907 | 153,804 | 168,944 | 174,275 | 190,230 | 194,413 |
| 2000's | 218,283 | 215,527 | 250,118 | 202,784 | 250,261 | 267,766 | 319,268 | NA | 276,340 | 389,830 |
| 2010's | 385,917 | 0 | 0 | 0 | ||||||
| 2020's | 0 | 0 | 0 | 0 |
| - = No Data Reported; -- = Not Applicable; NA = Not Available; W = Withheld to avoid disclosure of individual company data. |
| Release Date: 6/30/2026 |
| Next Release Date: 7/31/2026 |