|
Download Data (XLS File) |
|
|||||
|
|||||
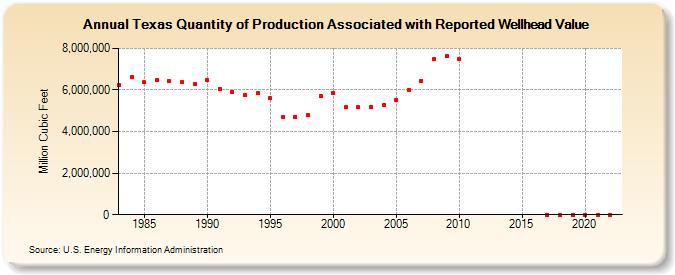
| Texas Quantity of Production Associated with Reported Wellhead Value (Million Cubic Feet) | |||||
| Decade | Year-0 | Year-1 | Year-2 | Year-3 | Year-4 | Year-5 | Year-6 | Year-7 | Year-8 | Year-9 |
|---|---|---|---|---|---|---|---|---|---|---|
| 1980's | 6,227,995 | 6,630,246 | 6,367,936 | 6,465,964 | 6,414,021 | 6,386,544 | 6,276,968 | |||
| 1990's | 6,476,032 | 6,066,256 | 5,893,069 | 5,769,437 | 5,834,671 | 5,592,323 | 4,684,140 | 4,716,304 | 4,777,945 | 5,719,128 |
| 2000's | 5,869,901 | 5,159,233 | 5,166,315 | 5,186,213 | 5,271,306 | 5,539,052 | 5,993,702 | 6,454,249 | 7,483,842 | 7,623,747 |
| 2010's | 7,470,752 | 0 | 0 | 0 | ||||||
| 2020's | 0 | 0 | 0 | 0 |
| - = No Data Reported; -- = Not Applicable; NA = Not Available; W = Withheld to avoid disclosure of individual company data. |
| Release Date: 6/30/2026 |
| Next Release Date: 7/31/2026 |