|
Download Data (XLS File) |
|
|||||
|
|||||
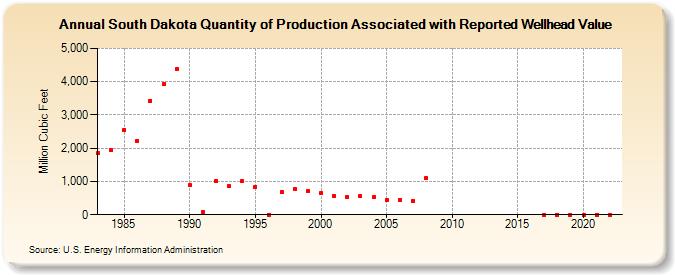
| South Dakota Quantity of Production Associated with Reported Wellhead Value (Million Cubic Feet) | |||||
| Decade | Year-0 | Year-1 | Year-2 | Year-3 | Year-4 | Year-5 | Year-6 | Year-7 | Year-8 | Year-9 |
|---|---|---|---|---|---|---|---|---|---|---|
| 1980's | 1,846 | 1,947 | 2,558 | 2,231 | 3,431 | 3,920 | 4,369 | |||
| 1990's | 881 | 93 | 1,006 | 854 | 1,000 | 848 | 0 | 687 | 772 | 702 |
| 2000's | 648 | 563 | 531 | 550 | 531 | 446 | 455 | 422 | 1,099 | NA |
| 2010's | NA | 0 | 0 | 0 | ||||||
| 2020's | 0 | 0 | 0 | 0 |
| - = No Data Reported; -- = Not Applicable; NA = Not Available; W = Withheld to avoid disclosure of individual company data. |
| Release Date: 6/30/2026 |
| Next Release Date: 7/31/2026 |