|
Download Data (XLS File) |
|
|||||
|
|||||
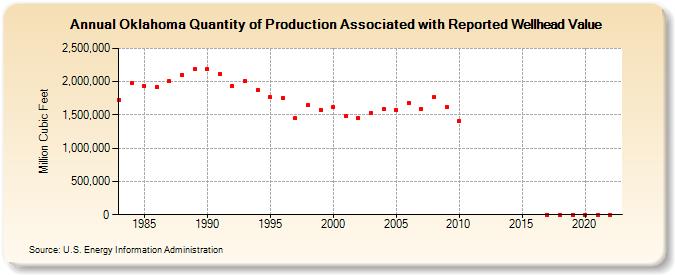
| Oklahoma Quantity of Production Associated with Reported Wellhead Value (Million Cubic Feet) | |||||
| Decade | Year-0 | Year-1 | Year-2 | Year-3 | Year-4 | Year-5 | Year-6 | Year-7 | Year-8 | Year-9 |
|---|---|---|---|---|---|---|---|---|---|---|
| 1980's | 1,730,061 | 1,985,869 | 1,936,341 | 1,917,493 | 2,004,797 | 2,106,632 | 2,185,204 | |||
| 1990's | 2,186,153 | 2,119,161 | 1,937,224 | 2,005,971 | 1,879,257 | 1,765,788 | 1,751,487 | 1,452,233 | 1,644,531 | 1,577,961 |
| 2000's | 1,612,890 | 1,477,058 | 1,456,375 | 1,531,657 | 1,584,905 | 1,571,615 | 1,683,563 | 1,589,871 | 1,765,988 | 1,621,316 |
| 2010's | 1,408,061 | 0 | 0 | 0 | ||||||
| 2020's | 0 | 0 | 0 | 0 |
| - = No Data Reported; -- = Not Applicable; NA = Not Available; W = Withheld to avoid disclosure of individual company data. |
| Release Date: 6/30/2026 |
| Next Release Date: 7/31/2026 |