|
Download Data (XLS File) |
|
|||||
|
|||||
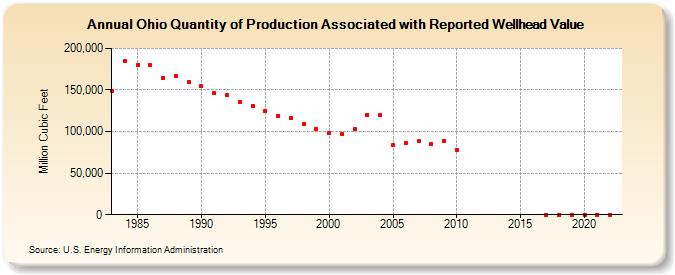
| Ohio Quantity of Production Associated with Reported Wellhead Value (Million Cubic Feet) | |||||
| Decade | Year-0 | Year-1 | Year-2 | Year-3 | Year-4 | Year-5 | Year-6 | Year-7 | Year-8 | Year-9 |
|---|---|---|---|---|---|---|---|---|---|---|
| 1980's | 149,096 | 184,651 | 180,458 | 180,287 | 164,960 | 166,690 | 159,730 | |||
| 1990's | 154,619 | 146,189 | 143,381 | 135,939 | 130,855 | 125,085 | 119,251 | 116,246 | 108,542 | 102,505 |
| 2000's | 98,551 | 97,272 | 103,158 | 120,081 | 119,847 | 83,523 | 86,315 | 88,095 | 84,858 | 88,824 |
| 2010's | 78,122 | 0 | 0 | 0 | ||||||
| 2020's | 0 | 0 | 0 | 0 |
| - = No Data Reported; -- = Not Applicable; NA = Not Available; W = Withheld to avoid disclosure of individual company data. |
| Release Date: 6/30/2026 |
| Next Release Date: 7/31/2026 |