|
Download Data (XLS File) |
|
|||||
|
|||||
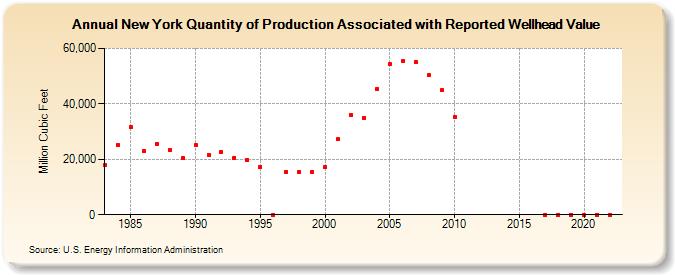
| New York Quantity of Production Associated with Reported Wellhead Value (Million Cubic Feet) | |||||
| Decade | Year-0 | Year-1 | Year-2 | Year-3 | Year-4 | Year-5 | Year-6 | Year-7 | Year-8 | Year-9 |
|---|---|---|---|---|---|---|---|---|---|---|
| 1980's | 17,836 | 25,200 | 31,561 | 22,964 | 25,676 | 23,455 | 20,433 | |||
| 1990's | 25,023 | 21,704 | 22,543 | 20,620 | 19,684 | 17,325 | 0 | 15,415 | 15,415 | 15,426 |
| 2000's | 17,166 | 27,187 | 35,941 | 35,044 | 45,436 | 54,377 | 55,344 | 54,942 | 50,320 | 44,849 |
| 2010's | 35,241 | 0 | 0 | 0 | ||||||
| 2020's | 0 | 0 | 0 | 0 |
| - = No Data Reported; -- = Not Applicable; NA = Not Available; W = Withheld to avoid disclosure of individual company data. |
| Release Date: 6/30/2026 |
| Next Release Date: 7/31/2026 |