|
Download Data (XLS File) |
|
|||||
|
|||||
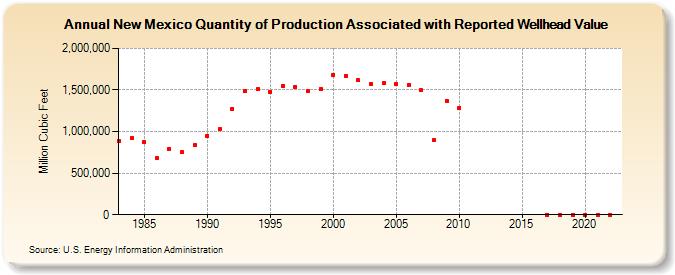
| New Mexico Quantity of Production Associated with Reported Wellhead Value (Million Cubic Feet) | |||||
| Decade | Year-0 | Year-1 | Year-2 | Year-3 | Year-4 | Year-5 | Year-6 | Year-7 | Year-8 | Year-9 |
|---|---|---|---|---|---|---|---|---|---|---|
| 1980's | 884,517 | 925,298 | 880,307 | 676,886 | 790,639 | 752,629 | 833,593 | |||
| 1990's | 949,735 | 1,029,824 | 1,274,220 | 1,489,052 | 1,510,804 | 1,480,327 | 1,553,103 | 1,540,157 | 1,483,370 | 1,511,671 |
| 2000's | 1,685,664 | 1,670,644 | 1,614,045 | 1,576,639 | 1,578,773 | 1,571,920 | 1,562,754 | 1,495,615 | 895,675 | 1,370,727 |
| 2010's | 1,287,399 | 0 | 0 | 0 | ||||||
| 2020's | 0 | 0 | 0 | 0 |
| - = No Data Reported; -- = Not Applicable; NA = Not Available; W = Withheld to avoid disclosure of individual company data. |
| Release Date: 6/30/2026 |
| Next Release Date: 7/31/2026 |