|
Download Data (XLS File) |
|
|||||
|
|||||
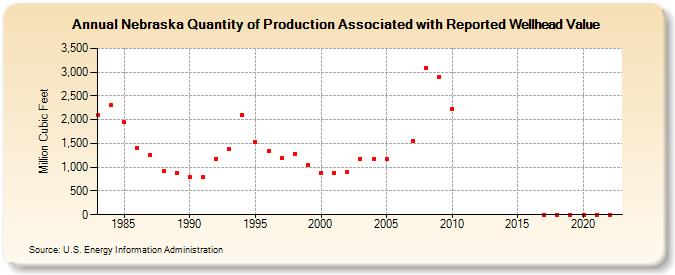
| Nebraska Quantity of Production Associated with Reported Wellhead Value (Million Cubic Feet) | |||||
| Decade | Year-0 | Year-1 | Year-2 | Year-3 | Year-4 | Year-5 | Year-6 | Year-7 | Year-8 | Year-9 |
|---|---|---|---|---|---|---|---|---|---|---|
| 1980's | 2,091 | 2,300 | 1,944 | 1,403 | 1,261 | 910 | 878 | |||
| 1990's | 793 | 785 | 1,177 | 1,375 | 2,098 | 1,538 | 1,332 | 1,194 | 1,285 | 1,049 |
| 2000's | 879 | 883 | 892 | 1,168 | 1,172 | 1,172 | NA | 1,555 | 3,082 | 2,908 |
| 2010's | 2,231 | 0 | 0 | 0 | ||||||
| 2020's | 0 | 0 | 0 | 0 |
| - = No Data Reported; -- = Not Applicable; NA = Not Available; W = Withheld to avoid disclosure of individual company data. |
| Release Date: 6/30/2026 |
| Next Release Date: 7/31/2026 |