|
Download Data (XLS File) |
|
|||||
|
|||||
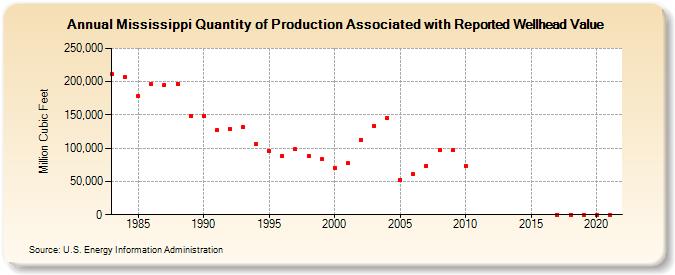
| Mississippi Quantity of Production Associated with Reported Wellhead Value (Million Cubic Feet) | |||||
| Decade | Year-0 | Year-1 | Year-2 | Year-3 | Year-4 | Year-5 | Year-6 | Year-7 | Year-8 | Year-9 |
|---|---|---|---|---|---|---|---|---|---|---|
| 1980's | 211,116 | 206,871 | 178,426 | 197,217 | 195,299 | 196,912 | 148,167 | |||
| 1990's | 149,012 | 126,637 | 129,340 | 131,450 | 105,646 | 95,349 | 88,805 | 98,075 | 88,723 | 83,232 |
| 2000's | 70,965 | 76,986 | 112,979 | 133,901 | 145,692 | 52,923 | 60,531 | 73,460 | 96,641 | 97,258 |
| 2010's | 73,721 | 0 | 0 | 0 | ||||||
| 2020's | 0 | 0 | 0 | 0 |
| - = No Data Reported; -- = Not Applicable; NA = Not Available; W = Withheld to avoid disclosure of individual company data. |
| Release Date: 6/30/2026 |
| Next Release Date: 7/31/2026 |