|
Download Data (XLS File) |
|
|||||
|
|||||
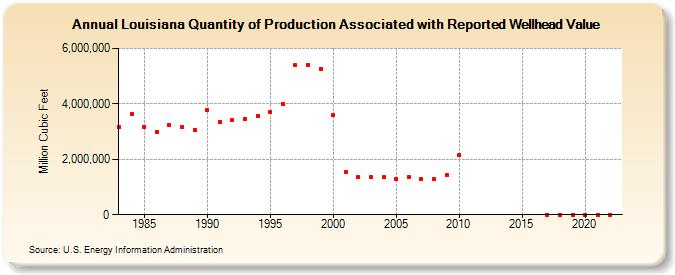
| Louisiana Quantity of Production Associated with Reported Wellhead Value (Million Cubic Feet) | |||||
| Decade | Year-0 | Year-1 | Year-2 | Year-3 | Year-4 | Year-5 | Year-6 | Year-7 | Year-8 | Year-9 |
|---|---|---|---|---|---|---|---|---|---|---|
| 1980's | 3,149,192 | 3,650,412 | 3,179,306 | 2,986,468 | 3,243,795 | 3,158,903 | 3,066,789 | |||
| 1990's | 3,780,551 | 3,355,867 | 3,404,963 | 3,454,646 | 3,562,360 | 3,709,015 | 3,976,305 | 5,398,216 | 5,410,523 | 5,265,670 |
| 2000's | 3,587,815 | 1,529,733 | 1,365,925 | 1,350,399 | 1,357,366 | 1,296,048 | 1,361,119 | 1,275,806 | 1,292,478 | 1,449,809 |
| 2010's | 2,140,525 | 0 | 0 | 0 | ||||||
| 2020's | 0 | 0 | 0 | 0 |
| - = No Data Reported; -- = Not Applicable; NA = Not Available; W = Withheld to avoid disclosure of individual company data. |
| Release Date: 6/30/2026 |
| Next Release Date: 7/31/2026 |