|
Download Data (XLS File) |
|
|||||
|
|||||
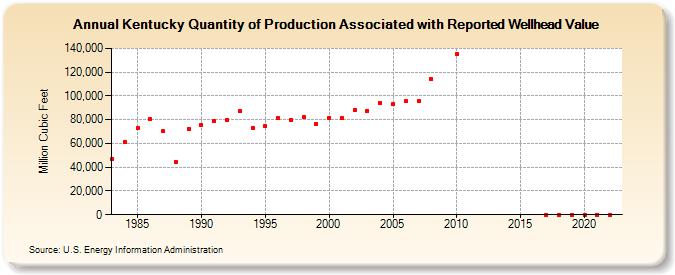
| Kentucky Quantity of Production Associated with Reported Wellhead Value (Million Cubic Feet) | |||||
| Decade | Year-0 | Year-1 | Year-2 | Year-3 | Year-4 | Year-5 | Year-6 | Year-7 | Year-8 | Year-9 |
|---|---|---|---|---|---|---|---|---|---|---|
| 1980's | 46,720 | 61,518 | 73,126 | 80,195 | 70,125 | 44,725 | 72,417 | |||
| 1990's | 75,333 | 78,904 | 79,690 | 86,966 | 73,081 | 74,754 | 81,435 | 79,547 | 81,868 | 76,770 |
| 2000's | 81,545 | 81,723 | 88,259 | 87,609 | 94,259 | 92,795 | 95,320 | 95,437 | 114,116 | NA |
| 2010's | 135,355 | 0 | 0 | 0 | ||||||
| 2020's | 0 | 0 | 0 | 0 |
| - = No Data Reported; -- = Not Applicable; NA = Not Available; W = Withheld to avoid disclosure of individual company data. |
| Release Date: 6/30/2026 |
| Next Release Date: 7/31/2026 |