|
Download Data (XLS File) |
|
|||||
|
|||||
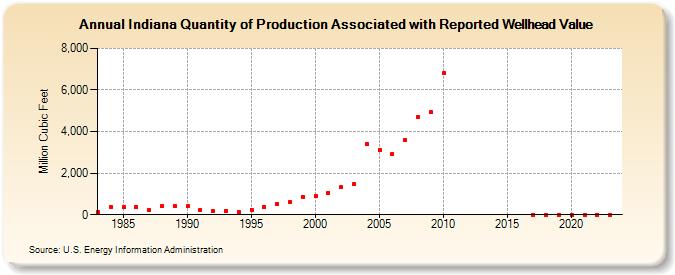
| Indiana Quantity of Production Associated with Reported Wellhead Value (Million Cubic Feet) | |||||
| Decade | Year-0 | Year-1 | Year-2 | Year-3 | Year-4 | Year-5 | Year-6 | Year-7 | Year-8 | Year-9 |
|---|---|---|---|---|---|---|---|---|---|---|
| 1980's | 135 | 394 | 367 | 365 | 217 | 412 | 416 | |||
| 1990's | 399 | 232 | 174 | 192 | 107 | 249 | 360 | 526 | 615 | 855 |
| 2000's | 899 | 1,064 | 1,309 | 1,464 | 3,401 | 3,135 | 2,921 | 3,606 | 4,701 | 4,927 |
| 2010's | 6,802 | 0 | 0 | 0 | ||||||
| 2020's | 0 | 0 | 0 | 0 |
| - = No Data Reported; -- = Not Applicable; NA = Not Available; W = Withheld to avoid disclosure of individual company data. |
| Release Date: 6/30/2026 |
| Next Release Date: 7/31/2026 |