|
Download Data (XLS File) |
|
|||||
|
|||||
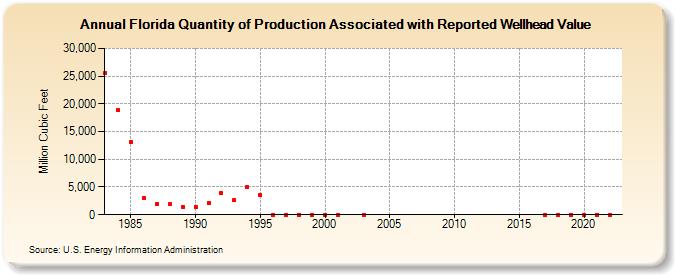
| Florida Quantity of Production Associated with Reported Wellhead Value (Million Cubic Feet) | |||||
| Decade | Year-0 | Year-1 | Year-2 | Year-3 | Year-4 | Year-5 | Year-6 | Year-7 | Year-8 | Year-9 |
|---|---|---|---|---|---|---|---|---|---|---|
| 1980's | 25,630 | 18,897 | 13,162 | 3,004 | 1,893 | 1,883 | 1,437 | |||
| 1990's | 1,443 | 2,096 | 3,849 | 2,612 | 4,940 | 3,545 | 0 | 0 | 0 | 0 |
| 2000's | 0 | 0 | NA | 0 | NA | NA | NA | NA | NA | NA |
| 2010's | NA | 0 | 0 | 0 | ||||||
| 2020's | 0 | 0 | 0 | 0 |
| - = No Data Reported; -- = Not Applicable; NA = Not Available; W = Withheld to avoid disclosure of individual company data. |
| Release Date: 6/30/2026 |
| Next Release Date: 7/31/2026 |