|
Download Data (XLS File) |
|
|||||
|
|||||
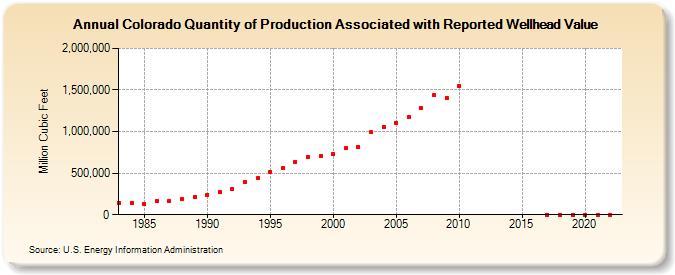
| Colorado Quantity of Production Associated with Reported Wellhead Value (Million Cubic Feet) | |||||
| Decade | Year-0 | Year-1 | Year-2 | Year-3 | Year-4 | Year-5 | Year-6 | Year-7 | Year-8 | Year-9 |
|---|---|---|---|---|---|---|---|---|---|---|
| 1980's | 139,820 | 143,552 | 126,037 | 163,684 | 164,557 | 191,544 | 216,737 | |||
| 1990's | 242,997 | 271,159 | 314,105 | 388,016 | 441,343 | 511,513 | 559,473 | 637,375 | 696,321 | 705,477 |
| 2000's | 735,332 | 800,712 | 819,205 | 989,678 | 1,058,383 | 1,106,993 | 1,170,819 | 1,280,638 | 1,436,203 | 1,409,172 |
| 2010's | 1,548,576 | 0 | 0 | 0 | ||||||
| 2020's | 0 | 0 | 0 | 0 |
| - = No Data Reported; -- = Not Applicable; NA = Not Available; W = Withheld to avoid disclosure of individual company data. |
| Release Date: 6/30/2026 |
| Next Release Date: 7/31/2026 |