|
Download Data (XLS File) |
|
|||||
|
|||||
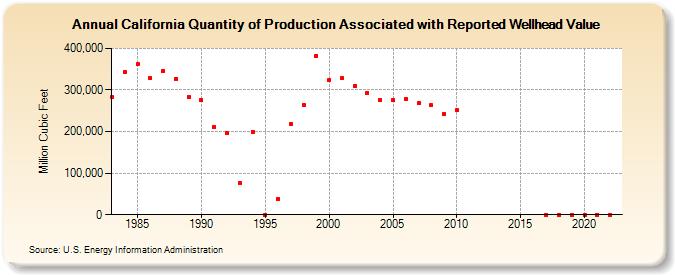
| California Quantity of Production Associated with Reported Wellhead Value (Million Cubic Feet) | |||||
| Decade | Year-0 | Year-1 | Year-2 | Year-3 | Year-4 | Year-5 | Year-6 | Year-7 | Year-8 | Year-9 |
|---|---|---|---|---|---|---|---|---|---|---|
| 1980's | 282,639 | 343,079 | 361,739 | 329,366 | 346,720 | 327,399 | 283,509 | |||
| 1990's | 275,738 | 211,841 | 195,515 | 76,381 | 199,649 | 263 | 37,823 | 219,216 | 264,810 | 382,715 |
| 2000's | 323,864 | 328,778 | 309,399 | 293,691 | 276,520 | 274,817 | 278,933 | 268,016 | 263,107 | 241,916 |
| 2010's | 251,559 | 0 | 0 | 0 | ||||||
| 2020's | 0 | 0 | 0 | 0 |
| - = No Data Reported; -- = Not Applicable; NA = Not Available; W = Withheld to avoid disclosure of individual company data. |
| Release Date: 6/30/2026 |
| Next Release Date: 7/31/2026 |