|
Download Data (XLS File) |
|
|||||
|
|||||
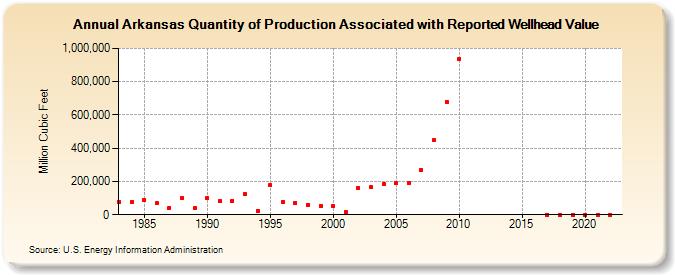
| Arkansas Quantity of Production Associated with Reported Wellhead Value (Million Cubic Feet) | |||||
| Decade | Year-0 | Year-1 | Year-2 | Year-3 | Year-4 | Year-5 | Year-6 | Year-7 | Year-8 | Year-9 |
|---|---|---|---|---|---|---|---|---|---|---|
| 1980's | 78,097 | 75,575 | 86,552 | 68,206 | 42,688 | 102,046 | 42,226 | |||
| 1990's | 99,456 | 83,864 | 85,177 | 122,596 | 24,326 | 180,117 | 76,671 | 71,449 | 61,012 | 54,382 |
| 2000's | 55,057 | 16,901 | 161,871 | 166,329 | 183,299 | 190,533 | 193,491 | 269,886 | 446,551 | 680,613 |
| 2010's | 936,600 | 0 | 0 | 0 | ||||||
| 2020's | 0 | 0 | 0 | 0 |
| - = No Data Reported; -- = Not Applicable; NA = Not Available; W = Withheld to avoid disclosure of individual company data. |
| Release Date: 6/30/2026 |
| Next Release Date: 7/31/2026 |