|
Download Data (XLS File) |
|
|||||
|
|||||
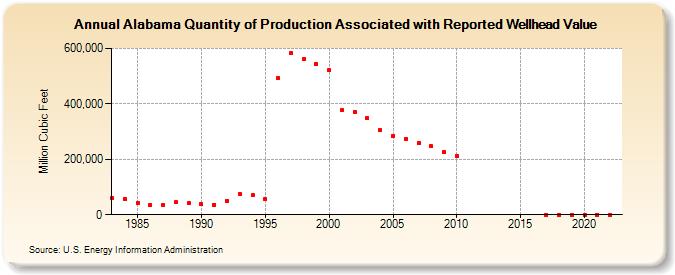
| Alabama Quantity of Production Associated with Reported Wellhead Value (Million Cubic Feet) | |||||
| Decade | Year-0 | Year-1 | Year-2 | Year-3 | Year-4 | Year-5 | Year-6 | Year-7 | Year-8 | Year-9 |
|---|---|---|---|---|---|---|---|---|---|---|
| 1980's | 59,051 | 56,685 | 42,925 | 34,164 | 35,674 | 45,488 | 41,614 | |||
| 1990's | 37,229 | 35,972 | 51,219 | 75,474 | 70,489 | 54,964 | 493,069 | 583,370 | 560,414 | 544,020 |
| 2000's | 521,215 | 376,241 | 370,753 | 348,722 | 304,212 | 285,237 | 274,176 | 259,062 | 246,747 | 225,666 |
| 2010's | 212,769 | 0 | 0 | 0 | ||||||
| 2020's | 0 | 0 | 0 | 0 |
| - = No Data Reported; -- = Not Applicable; NA = Not Available; W = Withheld to avoid disclosure of individual company data. |
| Release Date: 6/30/2026 |
| Next Release Date: 7/31/2026 |