|
Download Data (XLS File) |
|
|||||
|
|||||
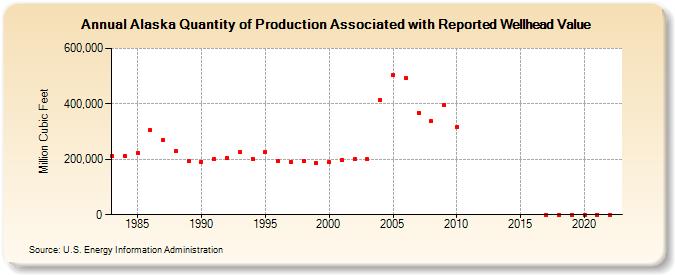
| Alaska Quantity of Production Associated with Reported Wellhead Value (Million Cubic Feet) | |||||
| Decade | Year-0 | Year-1 | Year-2 | Year-3 | Year-4 | Year-5 | Year-6 | Year-7 | Year-8 | Year-9 |
|---|---|---|---|---|---|---|---|---|---|---|
| 1980's | 211,569 | 211,579 | 222,637 | 304,841 | 271,120 | 228,284 | 192,760 | |||
| 1990's | 191,798 | 200,557 | 206,259 | 224,786 | 201,891 | 227,797 | 193,278 | 191,017 | 192,982 | 186,727 |
| 2000's | 189,896 | 197,735 | 200,871 | 199,616 | 413,667 | 502,887 | 494,323 | 368,344 | 337,359 | 397,077 |
| 2010's | 316,546 | 0 | 0 | 0 | ||||||
| 2020's | 0 | 0 | 0 | 0 |
| - = No Data Reported; -- = Not Applicable; NA = Not Available; W = Withheld to avoid disclosure of individual company data. |
| Release Date: 6/30/2026 |
| Next Release Date: 7/31/2026 |