|
Download Data (XLS File) |
|
|||||
|
|||||
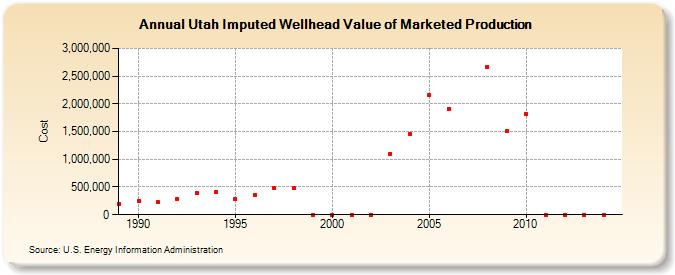
| Utah Imputed Wellhead Value of Marketed Production (Cost) | |||||
| Decade | Year-0 | Year-1 | Year-2 | Year-3 | Year-4 | Year-5 | Year-6 | Year-7 | Year-8 | Year-9 |
|---|---|---|---|---|---|---|---|---|---|---|
| 1980's | 189,742 | |||||||||
| 1990's | 248,330 | 223,018 | 279,208 | 398,202 | 417,034 | 276,880 | 347,402 | 478,465 | 479,139 | 0 |
| 2000's | 0 | 0 | 0 | 1,102,513 | 1,457,738 | 2,157,248 | 1,912,832 | NA | 2,667,520 | 1,503,209 |
| 2010's | 1,825,566 | 0 | 0 | 0 | 0 |
| - = No Data Reported; -- = Not Applicable; NA = Not Available; W = Withheld to avoid disclosure of individual company data. |
| Release Date: 6/30/2026 |
| Next Release Date: 7/31/2026 |