|
Download Data (XLS File) |
|
|||||
|
|||||
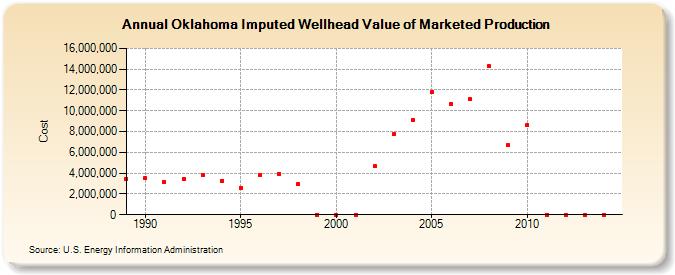
| Oklahoma Imputed Wellhead Value of Marketed Production (Cost) | |||||
| Decade | Year-0 | Year-1 | Year-2 | Year-3 | Year-4 | Year-5 | Year-6 | Year-7 | Year-8 | Year-9 |
|---|---|---|---|---|---|---|---|---|---|---|
| 1980's | 3,467,394 | |||||||||
| 1990's | 3,547,990 | 3,166,162 | 3,429,505 | 3,858,893 | 3,289,965 | 2,616,144 | 3,839,565 | 3,960,091 | 2,958,886 | 0 |
| 2000's | 0 | 0 | 4,657,435 | 7,736,847 | 9,145,956 | 11,821,278 | 10,670,823 | 11,129,281 | 14,261,922 | 6,704,410 |
| 2010's | 8,606,898 | 0 | 0 | 0 | 0 |
| - = No Data Reported; -- = Not Applicable; NA = Not Available; W = Withheld to avoid disclosure of individual company data. |
| Release Date: 6/30/2026 |
| Next Release Date: 7/31/2026 |