|
Download Data (XLS File) |
|
|||||
|
|||||
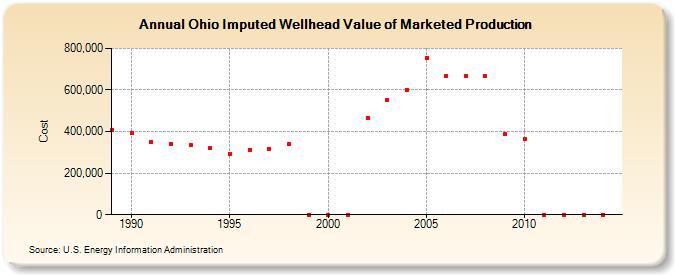
| Ohio Imputed Wellhead Value of Marketed Production (Cost) | |||||
| Decade | Year-0 | Year-1 | Year-2 | Year-3 | Year-4 | Year-5 | Year-6 | Year-7 | Year-8 | Year-9 |
|---|---|---|---|---|---|---|---|---|---|---|
| 1980's | 407,840 | |||||||||
| 1990's | 393,045 | 351,409 | 340,315 | 337,074 | 320,875 | 294,124 | 313,631 | 313,864 | 339,141 | 0 |
| 2000's | 0 | 0 | 466,391 | 552,480 | 601,666 | 754,213 | 668,942 | 668,942 | 668,942 | 387,274 |
| 2010's | 362,000 | 0 | 0 | 0 | 0 |
| - = No Data Reported; -- = Not Applicable; NA = Not Available; W = Withheld to avoid disclosure of individual company data. |
| Release Date: 6/30/2026 |
| Next Release Date: 7/31/2026 |