|
Download Data (XLS File) |
|
|||||
|
|||||
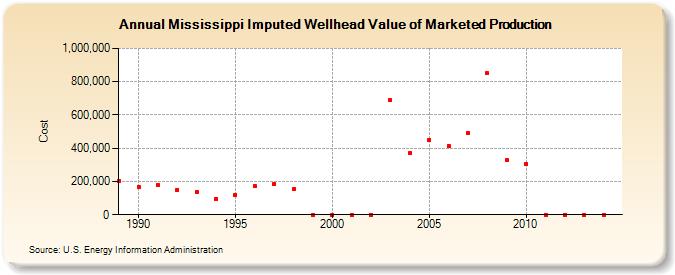
| Mississippi Imputed Wellhead Value of Marketed Production (Cost) | |||||
| Decade | Year-0 | Year-1 | Year-2 | Year-3 | Year-4 | Year-5 | Year-6 | Year-7 | Year-8 | Year-9 |
|---|---|---|---|---|---|---|---|---|---|---|
| 1980's | 201,834 | |||||||||
| 1990's | 166,915 | 179,332 | 150,382 | 139,361 | 94,834 | 118,275 | 171,775 | 185,880 | 153,193 | 0 |
| 2000's | 0 | 0 | 0 | 687,507 | 369,355 | 451,740 | 414,141 | 491,961 | 850,360 | 328,695 |
| 2010's | 307,738 | 0 | 0 | 0 | 0 |
| - = No Data Reported; -- = Not Applicable; NA = Not Available; W = Withheld to avoid disclosure of individual company data. |
| Release Date: 6/30/2026 |
| Next Release Date: 7/31/2026 |