|
Download Data (XLS File) |
|
|||||
|
|||||
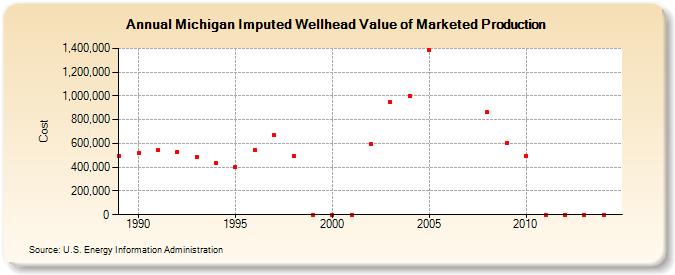
| Michigan Imputed Wellhead Value of Marketed Production (Cost) | |||||
| Decade | Year-0 | Year-1 | Year-2 | Year-3 | Year-4 | Year-5 | Year-6 | Year-7 | Year-8 | Year-9 |
|---|---|---|---|---|---|---|---|---|---|---|
| 1980's | 492,261 | |||||||||
| 1990's | 516,661 | 546,140 | 527,949 | 486,934 | 435,984 | 398,678 | 544,019 | 670,175 | 491,224 | 0 |
| 2000's | 0 | 0 | 594,189 | 950,218 | 1,000,495 | 1,382,673 | NA | NA | 862,122 | 602,645 |
| 2010's | 496,371 | 0 | 0 | 0 | 0 |
| - = No Data Reported; -- = Not Applicable; NA = Not Available; W = Withheld to avoid disclosure of individual company data. |
| Release Date: 6/30/2026 |
| Next Release Date: 7/31/2026 |