|
Download Data (XLS File) |
|
|||||
|
|||||
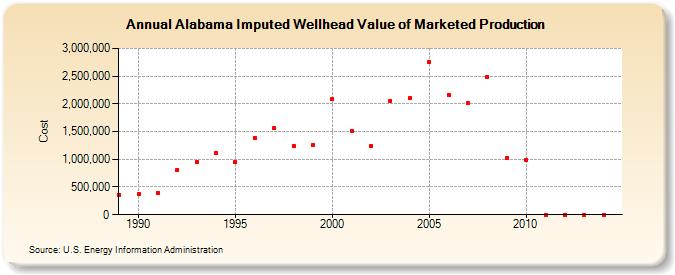
| Alabama Imputed Wellhead Value of Marketed Production (Cost) | |||||
| Decade | Year-0 | Year-1 | Year-2 | Year-3 | Year-4 | Year-5 | Year-6 | Year-7 | Year-8 | Year-9 |
|---|---|---|---|---|---|---|---|---|---|---|
| 1980's | 349,478 | |||||||||
| 1990's | 372,522 | 398,074 | 813,178 | 956,293 | 1,118,722 | 947,783 | 1,389,944 | 1,556,655 | 1,242,353 | 1,261,009 |
| 2000's | 2,083,290 | 1,509,768 | 1,237,960 | 2,051,308 | 2,103,279 | 2,750,513 | 2,167,627 | 2,010,736 | 2,489,704 | 1,020,599 |
| 2010's | 994,688 | 0 | 0 | 0 | 0 |
| - = No Data Reported; -- = Not Applicable; NA = Not Available; W = Withheld to avoid disclosure of individual company data. |
| Release Date: 6/30/2026 |
| Next Release Date: 7/31/2026 |