|
Download Data (XLS File) |
|
|||||
|
|||||
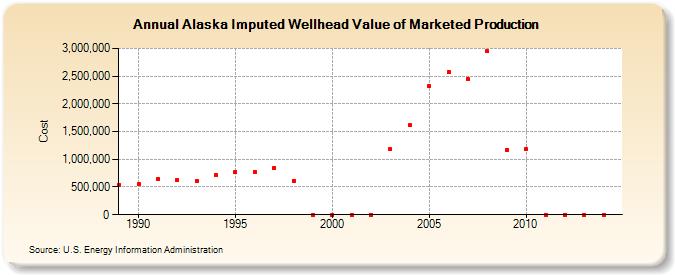
| Alaska Imputed Wellhead Value of Marketed Production (Cost) | |||||
| Decade | Year-0 | Year-1 | Year-2 | Year-3 | Year-4 | Year-5 | Year-6 | Year-7 | Year-8 | Year-9 |
|---|---|---|---|---|---|---|---|---|---|---|
| 1980's | 536,342 | |||||||||
| 1990's | 554,376 | 647,976 | 625,471 | 611,260 | 707,821 | 770,620 | 772,435 | 850,200 | 614,291 | 0 |
| 2000's | 0 | 0 | 0 | 1,179,378 | 1,611,562 | 2,313,492 | 2,576,028 | 2,439,193 | 2,944,546 | 1,163,554 |
| 2010's | 1,185,249 | 0 | 0 | 0 | 0 |
| - = No Data Reported; -- = Not Applicable; NA = Not Available; W = Withheld to avoid disclosure of individual company data. |
| Release Date: 6/30/2026 |
| Next Release Date: 7/31/2026 |