|
Download Data (XLS File) |
|
|||||
|
|||||
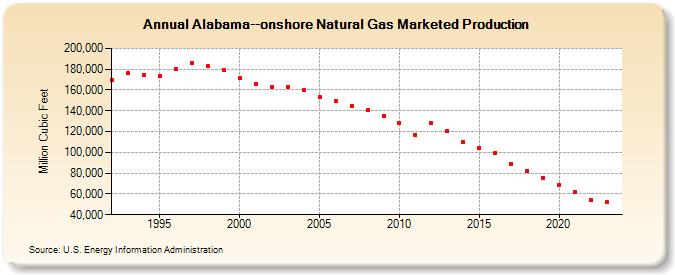
| Alabama--onshore Natural Gas Marketed Production (Million Cubic Feet) | |||||
| Decade | Year-0 | Year-1 | Year-2 | Year-3 | Year-4 | Year-5 | Year-6 | Year-7 | Year-8 | Year-9 |
|---|---|---|---|---|---|---|---|---|---|---|
| 1990's | 169,220 | 176,208 | 174,537 | 173,399 | 180,277 | 185,574 | 182,641 | 179,227 | ||
| 2000's | 171,917 | 165,622 | 162,613 | 162,524 | 159,924 | 153,179 | 149,415 | 144,579 | 140,401 | 134,757 |
| 2010's | 128,194 | 116,932 | 128,312 | 120,666 | 110,232 | 104,062 | 99,806 | 89,107 | 82,412 | 75,722 |
| 2020's | 68,731 | 61,732 | 54,559 | 51,476 | 45,255 |
| - = No Data Reported; -- = Not Applicable; NA = Not Available; W = Withheld to avoid disclosure of individual company data. |
| Release Date: 6/30/2026 |
| Next Release Date: 7/31/2026 |