|
Download Data (XLS File) |
|
|||||
|
|||||
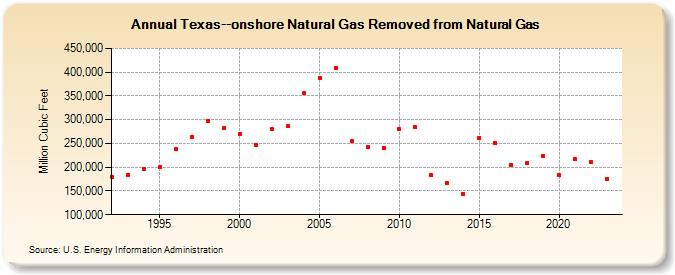
| Texas--onshore Natural Gas Removed from Natural Gas (Million Cubic Feet) | |||||
| Decade | Year-0 | Year-1 | Year-2 | Year-3 | Year-4 | Year-5 | Year-6 | Year-7 | Year-8 | Year-9 |
|---|---|---|---|---|---|---|---|---|---|---|
| 1990's | 180,003 | 184,258 | 196,463 | 200,233 | 238,897 | 263,397 | 296,412 | 282,462 | ||
| 2000's | 270,436 | 247,750 | 279,912 | 286,253 | 355,165 | 388,305 | 409,276 | 254,337 | 241,626 | 240,533 |
| 2010's | 279,981 | 284,557 | 183,118 | 166,328 | 143,891 | 262,174 | 250,813 | 204,334 | 209,855 | 223,975 |
| 2020's | 182,627 | 216,264 | 210,823 | 175,214 | 186,173 |
| - = No Data Reported; -- = Not Applicable; NA = Not Available; W = Withheld to avoid disclosure of individual company data. |
| Release Date: 6/30/2026 |
| Next Release Date: 7/31/2026 |